In February, in the same week that Russia invaded Ukraine, the IPCC issued a stark warning to the global community. Its message could not have been clearer: the climate is changing faster than our capacity to adapt. So the world must deliver better and faster. The global fossil fuel crisis must be a game changer. And my friends, let us not take the highway to hell; let us earn the clean ticket to heaven. That is our responsibility.
For Europe, the answer is REPowerEU. We are not just cutting our dependency on Russian fossil fuels – that is good, but that is not enough – but we are massively accelerating the roll-out of renewables. The European Union’s additional renewable capacity is set to more than double this year, up to 50 gigawatts. And if we accelerate and if we scale up – and that is our plan – we can, in the next year, meet a new all-time record of over 100 gigawatts of additional renewable capacity. Because we know that every kilowatt-hour of electricity that we generate from renewable sources – like solar and wind, and green hydrogen – is not only good for our climate, but also good for our independence and our security of supply.
Here, the Global South has the resources in abundance. So let us team up. That is why the European Union is signing new hydrogen partnerships with Egypt, with Namibia and with Kazakhstan. That is why we are supporting partners such as Vietnam and South Africa to decarbonise their economies. We need to reach the Paris goal. And Europe is staying the course.
We will reduce our greenhouse gas emissions by at least 55% until 2030. And that is cast in law. With our Fit for 55 Package, we are putting in place the most ambitious legal framework worldwide. And we call on all major emitters to increase their ambitions, too.
In addition, we need tangible progress on our global goal for adaptation. Those most in need, in the developing world, must be supported in adapting to a harsher climate. This is also why this COP must make progress on averting, minimising and addressing loss and damage from climate change. It is high time to put this on the agenda.
Finally, we urge our partners in the Global North to step up their climate finance to the Global South. Team Europe is providing its fair share of the USD 100 billion promise. For the second year in a row, we have exceeded EUR 23 billion – despite the COVID-19 pandemic, despite the Russian war. And a big bulk of our climate finance goes already to adaptation. So it is doable and we call on others to step up, too.
My message to you today is: Europe is staying the course. So let us do this journey together.
Thank you so much.
Watch President von der Leyen’s statement here
Compliments of the European Commission.
The post Statement by President von der Leyen at the COP27 plenary meeting first appeared on European American Chamber of Commerce New York [EACCNY] | Your Partner for Transatlantic Business Resources.
Following the European Council meeting of 20-21 October 2022, the Commission has today proposed an unprecedented support package for Ukraine of up to €18 billion for 2023. This will come in the form of highly concessional loans, disbursed in regular installments as of 2023.
This stable, regular and predictable financial assistance – averaging €1.5 billion per month – will help cover a significant part of Ukraine’s short-term funding needs for 2023, which the Ukrainian authorities and the International Monetary Fund estimate at €3 to €4 billion per month. The support put forward by the EU would need to be matched by similar efforts by other major donors in order to cover all of Ukraine’s funding needs for 2023.
Thanks to this package, Ukraine will be able to keep on paying wages and pensions and maintain essential public services running, such as hospitals, schools, and housing for relocated people. It will also allow Ukraine to ensure macroeconomic stability, and restore critical infrastructure destroyed by Russia in its war of aggression, such as energy infrastructure, water systems, transport networks, roads and bridges.
Support under the instrument will be accompanied by reforms, to further enhance the rule of law, good governance, anti-fraud and anti-corruption measures in Ukraine. Therefore, while taking into account the evolution on the ground, financial support will be framed by policy conditions, geared towards strengthening Ukraine’s institutions and preparing the ground for a successful reconstruction effort, as well as supporting Ukraine on its European path.
How will this package work?
Building on previous Macro-Financial Assistance packages, this Macro-Financial Assistance+ (MFA+) instrument offers high flexibility and very favourable terms for Ukraine, catering to the country’s current situation and ensuring swift action to support the Ukrainian people.
The funds will be provided through highly concessional loans, to be repaid in the course of maximum 35 years, starting in 2033. In a further expression of solidarity, the EU also proposes to cover Ukraine’s interest rate costs, through additional targeted payments by Member States into the EU budget. EU Member States and third countries will also be able to add more funds to the instrument, to be used as grants, should they wish to do so. The funds will then be channelled through the EU budget, allowing Ukraine to receive the support in a coordinated manner.
The MFA+ instrument will be accompanied by reforms to help Ukraine advance on its path to becoming a member of the EU. This means that the Ukrainian government will have to complement the financial support with sectoral and institutional reforms, including anti-corruption and judicial reforms, respect of the rule of law, good governance, and modernisation of the national and local institutions. We will check that these reforms have been effectively put in place when paying out the instalments.
How will the package be financed?
To secure the funds for the loans, the Commission proposes to borrow on capital markets using the diversified funding strategy. This would enable the Commission to use the full portfolio of funding instruments to secure market funding on the most advantageous terms, when these are needed.
To guarantee this borrowing for Ukraine, the Commission proposes to use the headroom of the 2021-2027 EU budget in a targeted manner for Ukraine, limited in time. The headroom is the difference between the own resources ceiling (i.e. the maximum amount of resources that the Commission can ask Member States to contribute in a given year) and the funds that it actually needs to cover the expenses foreseen by the budget. The headroom, which is already used to guarantee the borrowing for financial assistance programmes to Member States, will guarantee bond investors that the amounts lent to the EU to finance Ukrainian loans borrowing will be repaid under all circumstances.
Next steps
To ensure a smooth delivery of the package, the Commission is putting forward three legislative proposals. These will need approval by the European Parliament and EU Member States in the Council before entering into force.
As always, the Commission will be working hand in hand with all EU institutions concerned for a swift adoption.
Background
Russia’s unprovoked and unjustified invasion of Ukraine has inflicted horrific human pain and mass-scale destruction of towns and communities. The European Union and its Member States have shown unwavering solidarity with people fleeing the war. The Union has immediately mobilised support to the Ukrainian government to keep its essential functions going, on top of the emergency and humanitarian assistance, and military aid provided to Ukraine.
Since the start of the war, Team Europe has mobilised €19.7 billion to support Ukraine, a large part of which comes in the form of macro-financial assistance (MFA). We have already disbursed €4.2 billion in MFA and will disburse further €2.5 billion by the end of the month as second disbursement of EUR 5 billion emergency MFA. Another €620 million in grants as budget support has also been disbursed to help Ukraine cover urgent needs on the ground.
In addition, Member States have shown unprecedented solidarity by welcoming millions of people fleeing the war in Ukraine. To support these efforts, the EU has activated the Temporary Protection Directive, granting access to jobs, housing, education and healthcare across the EU to over 4 million people fleeing the war.
The Commission is also coordinating its largest ever operation under the EU Civil Protection Mechanism for a wide array of support measures for Ukrainian citizens, including in the health, energy, food and agriculture sectors, and providing shelters, machinery as well as vital medical and energy equipment and evacuations.
Furthermore, the Commission, together with the Member States and the Energy Community, has been providing support for the Ukrainian energy system since this spring, and stepped up its efforts following the targeted shelling of vital energy infrastructure. The EU’s Civil Protection Mechanism has facilitated the shipment of generators, transformers and cables, among others. Under the Ukraine Energy Support Fund established by the Energy Community at the request of the European Commission, €25.5 million have been made available to cover the immediate needs in the energy sector. The Commission also delivered more than €40 million worth Chemical, Biological, Radiological and Nuclear threat countermeasures and equipment from the EU reserves and allocated €13 million for the restoration of laboratories damaged by the Russian occupiers at Chornobyl.
To support Ukraine, the Commission has also put forward measures to facilitate trade, notably the suspension of import duties on Ukrainian exports, and to establish solidarity lanes to help Ukraine export agricultural goods.
In addition, military assistance measures amounting to €3.1 billion have been provided under the European Peace Facility. This will be used to reimburse Member States for their in-kind military support to Ukraine.
The EU’s efforts to support Ukraine come on top of the comprehensive set of actions put forward to tackle the dramatic consequences of Russia’s war of aggression. The invasion has led to the ramping up of energy prices and of the overall cost of living for citizens in the EU. In this context, both the EU and Member States have been taking concrete measures to support businesses and households, especially vulnerable ones, in their ability to pay their energy bills and to ensure access to energy supplies.
Compliments of the European Commission.
The post EU Commission proposes stable and predictable support package for Ukraine for 2023 of up to €18 billion first appeared on European American Chamber of Commerce New York [EACCNY] | Your Partner for Transatlantic Business Resources.
Europe is punching below its weight in the climate-technology competition. The continent needs to facilitate risk capital markets and to invest more in research and development. This is the 4th post in a series of climate-related entries on the occasion of COP27.
Virtually non-existent half a century ago, nowadays climate-friendly technologies and products like the electric car, the solar panel and the heat pump are all around us. This often creates the wrong impression that timely green transition is just a political problem: if only all governments agreed to put the right policies in place, global warming would no longer be an existential threat. In reality, the technological challenges may be even more daunting. A range of economic activities – from freight, water and air transportation to metallurgy or cement production – still involve burning fossil fuels, and green technological alternatives either do not exist or are not available at the necessary scale. Many climate-friendly technologies still need to be invented and implemented to have any hope of fulfilling the Paris Climate Agreement.
The EU has so far contributed less to the development of new green technologies than its size and wealth would suggest. We discuss why this is, and what can be done to jumpstart Europe’s green-innovation engine.[1]
Green innovation across the world
Globally, the number of per-capita green patents – defined as technological inventions that reduce greenhouse gas emissions when producing and consuming energy – increased five-fold between the 1970s and the early 2010s. The average EU member state has been a notable laggard in this process. For example, at the peak of green innovation in 2011, there were 17 green patents per 1 million population in the EU. In comparison, during that same year there were more than three times as many green patents per million population in the US (54) and four times as many in Japan (69).
There are also enormous differences across EU member states (see Figure 1). At one extreme is Denmark: with 92 green patents per 1 million population in 2011, it is ahead of all selected peers. Four other countries (Austria, Finland, Germany, and Sweden) are solid innovators, with more than 30 green patents per 1 million population. At the same time, one out of three EU countries registered less than 1 green patent per 1 million population.[2]
Chart 1
Green patents per million population in 2011
Source: PATSTAT and authors’ calculations.
Why so few green ideas?
There are three principal factors that stimulate innovation in green technologies. The first is pricing appropriately the carbon emissions released during production. When consumers are forced to pay the social cost of carbon emissions, producers have an incentive to invest in low-carbon technologies.[3] In this way, a carbon tax has a similar effect to an energy price shock, such as the oil price shock of the 1970s that led to many of the energy-saving technologies we use today.[4] At the same time, although all EU member states are covered by an Emissions Trading Scheme, as of end-2021 only 11 have some form of a carbon tax.
Second, higher levels of Venture Capital (VC) investment are associated with significantly higher number of green patents per capita (see Figure 2). This is to be expected given that unlike bank lending, equity investment is ideally suited to support risky investment, and from there all types of innovation, including new green technologies. It is not a coincidence that countries with deeper equity markets reduce their carbon footprint faster.[5] At present, however, Europe attracts only around 10% of global VC investment, compared with around 40% in both North America and China.
Chart 2
VC investment and green innovation in EU, 2005—2014
Source: European Venture Capital Association, Eurostat and PATSTAT.
Third, higher investment in research and development (R&D) is even more strongly correlated with more green innovation. This is hardly surprising: every piece of technology we use today was first an idea on the drawing board in a research lab. But though the Lisbon Agenda committed EU member states to spending at least 3% of their GDP on R&D 20 years ago, very few of them have consistently done so.
Would higher investment make a material difference? It would. Historically, the top performers in the EU in terms of VC and R&D investment, as a ratio of GDP, are Sweden and Finland, respectively. Our back-of-the-envelope calculations show that if every EU member state had similar investment to the top performers, green patents per capita in the EU right now would be higher than in the US.
We need more ambitious government policy
These observations imply that while both the private and the public sector have a role to play, governments are solely responsible for enacting policies that ultimately stimulate innovation. For one, there is a role for green R&D subsidies to private entreprises. And while large public spending on R&D is envisaged in the coming years, including through programmes like the EU’s Green Deal[6] and Horizon Europe,[7] projected overall outlays still fall way short of the 3% Lisbon target. The EU simply needs to spend much more on applied climate science if it wants to invent and commercialize the game-changing climate technologies of tomorrow. This applies both to individual countries and to the EU as a whole. In fact, one idea could be for climate-related R&D investment to involve a pooling of resources across EU member states, similar to the Airbus experience with aerospace design and manufacture.
In addition, while the EU is responsible for more than 30 % of all top scientific publications, it only has 12% of the world’s unicorns (start-up companies worth more than $1 billion). The disconnect between scientific quality and commercial success is largely due to an insufficiently dynamic VC industry. A more ambitious “green” Capital Markets Union with a strong equity finance component could facilitate the deepening of risk capital markets in the EU and increase their contribution to green innovation.
Now is the time to redouble our collective efforts and hasten along the path of decarbonisation.
And finally, while high energy prices at present make it politically possible to postpone the introduction of carbon taxes, a gradual and irreversible carbon pricing policy needs to be in place in the long run for green innovation to thrive.
The ECB is committed within its mandate to supporting the green transition. But while it can reinforce governments’ actions, governments are the only ones who have the proper tools to rev up Europe’s green innovation engine. If European governments put in place policies to support green innovation through R&D spending, risk capital markets and carbon pricing, then Europe has a real chance to become a green innovation leader.
The views expressed in each blog entry are those of the author(s) and do not necessarily represent the views of the European Central Bank and the Eurosystem.
1. The discussion in this blog is based on the results in Aghion, Boneva, Breckenfelder, Laeven, Olovsson, Popov, and Rancoita, 2022, “Financial Markets and Green Innovation,” ECB Working Paper 2686.
2. Differences across countries in green innovation broadly mirror differences in total innovation.
3. See Acemoglu, Aghion, Bursztyn, and Hemous, 2012, “The environment and directed technical change,” American Economic Review 102, 131–166.
4. See Hassler, Krussel, and Olovsson, 2021, “Directed technical change as a response to natural-resource scarcity,” Journal of Political Economy 129, 3039–3072.
5. See De Haas and Popov, 2022, “Finance and green growth,” Economic Journal, forthcoming.
6. See A European Green Deal.
7. See Horizon Europe.
Compliments of the European Central Bank.
The post ECB | Can Europe be a green innovation leader? first appeared on European American Chamber of Commerce New York [EACCNY] | Your Partner for Transatlantic Business Resources.
While there are multiple headwinds weighing on growth, further policy tightening is expected amid the need to bring down elevated inflation
Global economic growth prospects are confronting a unique mix of headwinds, including from Russia’s invasion of Ukraine, interest rate increases to contain inflation, and lingering pandemic effects such as China’s lockdowns and disruptions in supply chains.
In turn, our latest World Economic Outlook, released last month, lowered our global growth forecast for next year to 2.7 percent, and we expect countries accounting for more than one third of global output to contract during part of this year or next. Moreover, as we discuss in our latest report prepared for the Group of Twenty, recent high-frequency indicators confirm that the outlook is gloomier.
As the Chart of the Week shows, there has been a steady worsening in recent months for purchasing manager indices that are tracking a range of G20 economies. These survey-based measures gauge the momentum of manufacturing and services activity.
As the chart illustrates, readings for a growing share of G20 countries have fallen from expansionary territory earlier this year to levels that signal contraction. That is true for both advanced and emerging market economies, underscoring the slowdown’s global nature.
While gross domestic product releases for the third quarter surprised on the upside in some major economies, October PMI releases point to weakness in the fourth quarter, particularly in Europe. In China, intermittent pandemic lockdowns and the struggling real estate sector are contributing to a slowdown that can be seen not only in PMI data but also in investment, industrial production, and retail sales. This will inevitably have a significant impact on other economies due to China’s large role in trade.
Despite growing evidence of a global slowdown, policymakers should continue to prioritize containing inflation, which is contributing to a cost-of-living crisis, hurting low-income and vulnerable groups the most. As our G20 report emphasizes, the macroeconomic policy environment is unusually uncertain.
However, continued fiscal and monetary tightening is likely needed in many countries to bring down inflation and address debt vulnerabilities—and we do expect further tightening in many G20 economies in the months ahead. Nonetheless, these actions will continue to weigh on economic activity, especially in interest-sensitive sectors such as housing.
The challenges that the global economy is facing are immense and weakening economic indicators point to further challenges ahead. However, with careful policy action and joint multilateral efforts, the world can move toward stronger and more inclusive growth.
Author:
Tryggvi Gudmundsson, an economist in the IMF’s Research Department
Compliments of the IMF.
The post IMF | Slowing Global Economic Growth is Increasingly Evident, High-Frequency Data Show first appeared on European American Chamber of Commerce New York [EACCNY] | Your Partner for Transatlantic Business Resources.
Fertilisers play a significant role for food security. Their production and their cost largely depend on natural gas. Following Russia’s invasion of Ukraine, a global mineral fertiliser and energy crisis is now weighing on global food security and food prices. In this context, the European Commission presented today a Communication on ensuring availability and affordability of fertilisers. Today’s Communication presents a wide range of actions and guidance on how to tackle the challenges that EU farmers and industry, as well as developing countries, are currently facing. The need to reinforce the overall resilience and sustainability of our food systems in the medium and the long-term is also addressed, in line with the Communication on safeguarding food security adopted in March 2022, the Farm to Fork strategy and REPowerEU.
Actions to maintain a sustainable EU fertilisers’ production and reduce dependencies
The Communication outlines several best practices and ways ahead to help farmers optimise their fertiliser use and reduce their dependencies while securing yields:
Critical sector: Member States may prioritise the continued and undisrupted access to natural gas for fertiliser producers in their national emergency plans in the event of gas rationing, in line with the Commission Communication “Save gas for a safe winter”.
Targeted financial support: The amended Temporary Crisis Framework for State aid enables Member States to provide specific support to farmers and fertiliser producers. Funds generated by measures such as the cap on the market revenues of certain electricity generators and the solidarity contribution can also be used, subject to the applicable conditions, for purposes of national support schemes. Furthermore, the Commission will together with Member States examine the expediency of making use of the agricultural reserve worth €450 million for the financial year 2023 for farmers affected by high input costs.
Improved market transparency: The Commission will launch a market observatory for fertilisers in 2023 to share data on production, use, prices and trade.
Sustainable farming practices and training: The Commission will work with Member States to ensure that relevant interventions such as nutrient management plans, soil health improvement, precision farming, organic farming, use of leguminous crops in crop rotation schemes are widely adopted by farmers. The Commission will also invite Member States to look into further prioritisation and increasing the ambition of such interventions in future revisions of their CAP Strategic Plans.
More organic fertilisers: The substitution, whenever possible, of mineral fertilisers by organic fertilisers will reduce EU’s dependence on gas as well as the carbon footprint of the sector. The Fertilising Products Regulation already ensures a better access in the market to fertilisers made from recovered waste and green and circular alternatives to natural gas. Horizon Europe has also invested €180 million in projects on optimisation of nutrient budget, alternative fertilising products and nature-based solutions for nutrient management. The Commission will also adopt in 2023 an Integrated Nutrient Management Action Plan to foster a more efficient use of nutrients, taking into account Member States’ starting points and the Zero Pollution Action Plan.
Transition to greener fertilisers: The Commission will encourage Member States to support investments in renewable hydrogen and biomethane for ammonia production.
Trade diversification: The Commission has reached out to alternative suppliers of fertilisers to compensate for previous supplies from Belarus and Russia. The Commission also proposed in July 2022 to suspend trade tariffs for ammonia and urea, used to produce nitrogen fertilisers.
Actions to support vulnerable countries and improve global food security
Farmers worldwide and notably those in vulnerable countries acutely feel the impact of the tight fertiliser market. In the international field, the European Commission will continue its efforts to improve global food security by:
Continuing to work with its Member States and European Financial Institutions, in a Team Europe approach towards the contribution to the four strands of the Team Europe Response to Global Food Insecurity (Solidarity, Production, Trade and Multilateralism).
Cooperating with selected EU partner countries, including through the Global Fertilisers Challenge, to reduce their dependence and consumption on imported mineral fertilisers in improving nutrient management, increased fertiliser efficiency, and alternative agricultural practices, with a particular focus on extension and advisory services for farmers.
Improving global market transparency in fertilisers, by contributing to relevant international initiatives concerning fertilisers, in particular the G20’s Agricultural Market Information System (AMIS).
Stepping up the support to address balance of payments needs including through the IMF Poverty reduction and Growth Trust, and reinforce cooperation with international financial institutions (IFIs) under the Global Gateway to develop innovative and sustainable investments.
Initiating discussions on transparency improvements, including the avoidance of export restrictions on fertiliser trade in the WTO, with the view to delivering on the commitments taken under the declaration on food insecurity agreed at the last Ministerial Conference.
Continuing to work with Member States to ensure that global trade in agri-food products, including fertilisers, is able to proceed smoothly.
Further strengthening EU humanitarian food assistance, which is already over EUR 900 million so far in 2022. This is around 55 percent more than last year, and almost 80 percent more than in 2020.
Beyond fertilisers’ availability, affordability and use, the EU will continue to address the root causes of hunger, including conflict and insecurity, climate change, and economic shocks. The EU will work with its international partners and Member States to support the enhancement of local production capacities and the creation of sustainable and resilient food systems in the most fragile contexts. While promoting this objective, the EU will pave the way for innovative approaches in support of integrated soil fertility management, applying a diverse set of site-specific soil fertility solutions conducive to sustainable yield gains.
Background
Russia’s illegal invasion of Ukraine has worsened an already challenging situation for the fertiliser market, on the heels of the COVID-19 pandemic. The production of nitrogen fertilisers depends on natural gas. The peak in gas price led to a 149% price rise of fertilisers in September 2022 compared with the year before. As a result, farmers have been delaying and reducing their purchases of these products. This could lead to lower yields for next year’s harvest, and ultimately to higher food prices, with potentially devastating effects on food security, especially in vulnerable regions of the world that are highly dependent on import of such products and with already high levels of food insecurity.
High and unstable fertiliser prices are challenging for EU farmers. Purchases of fertilisers represent around 6% on average of the share of input costs and up to 12% for arable crop farmers. The objective of the EU’s Farm to-Fork strategy is to reduce nutrient losses by 50% by 2030 while preserving soil fertility. In addition to leading to clear economic and environmental benefits, efficiencies in the EU will reduce tensions in the global market too.
Compliments of the European Commission.
The post Food security: the EU Commission addresses the availability and affordability of fertilisers in the EU and globally first appeared on European American Chamber of Commerce New York [EACCNY] | Your Partner for Transatlantic Business Resources.
The return of inflation, higher interest rates, record-high debt levels and geopolitical tensions threaten to expose vulnerabilities within the financial system.
This letter was submitted to G20 Leader ahead of their meeting on 15-16 November.
The letter notes that developments since the Rome Summit have been a stark reminder that global financial stability should not be taken for granted. The return of inflation to levels not seen in decades has resulted in a strong interest rate response and significantly tighter financial conditions. The tightening is occurring amidst record-high levels of debt of non-financial corporates, households and governments globally, and in a global financial system where the provision of finance through non-banks has become as important as bank credit.
The letter notes that during the Indonesian G20 Presidency, the FSB has intensified its monitoring of current vulnerabilities and taken forward work to reinforce the resilience of the financial system. At the same time, the FSB has continued to work to enable the financial system to adapt to secular trends. The FSB has done so in three ways. First, by taking forward the Roadmap for Enhancing Cross-Border Payments, with the focus now being on three priority areas, cooperating closely with the private sector. Second, by developing a comprehensive framework for the regulation, supervision of oversight of crypto-assets activities and markets. Third, by working to address financial risks from climate change through enhancements to disclosures, data, vulnerabilities assessment and regulatory and supervisory policy. Work in all these areas will continue under the Indian G20 Presidency in 2023.
The letter outlines the reports being submitted to the November Summit, which cover:
Policy proposals to address systemic risk in NBFI
Key performance indicators to achieve targets for enhancing cross-border payments
Scenario analysis of climate-related financial risks to better understand the financial risks associated with transition to net zero
The FSB Chair asks for the G20’s continued and reinforced support for the work of the FSB to strengthen the resilience of the financial system as a whole. The challenges that lie ahead make global cooperation on financial stability matters as important now as it was after the global financial crisis, when the decisions of G20 Leaders triggered reforms that, coordinated through the FSB, have made the global financial system more resilient and growth-enhancing.
Compliments of the Financial Stability Board.
The post FSB Chair’s letter to G20 Leaders: November 2022 first appeared on European American Chamber of Commerce New York [EACCNY] | Your Partner for Transatlantic Business Resources.
As a small country with a high-income economy, limited natural resources and little manufacturing, the Netherlands has adopted policies to facilitate the knowledge economy. The Dutch government is therefore looking for ways to highly incentivize R&D activities performed in the Netherlands by providing tax incentives to Dutch companies and individuals. This is done by 1) greatly reducing wage taxes on the R&D performed in the Netherlands (the cost-side) and 2) providing a special corporate income tax regime for any profit generated with R&D (the profit side). Both lead to a lower Effective Tax Rate, thus higher free cashflows, and as such a higher Company Value on a DCF basis (check out our explanation of the DCF method for valuating companies: NL/ENG).
In this long-read, we will provide you with the ins and outs of these Dutch tax regimes that incentivize R&D activities.
1. The cost side: the ‘WBSO’
The WBSO is an R&D remittance reduction intended to incentivize businesses to invest in research & development. This incentive greatly mitigates the cost-burden of R&D-companies by reducing the wage tax of employees conducting R&D activities. To obtain the benefits, an application needs to be filed with the Dutch Enterprise Agency (RVO) (in Dutch: Rijksdienst voor Ondernemend Nederland). The application boils down to: 1) proving that you are dealing with a project that contains a technical bottleneck, which 2) cannot be solved by any known techniques, and 3) requiring you to perform R&D work to find a solution.
1.1 The wage tax reduction
For wage tax withholding agents (i.e. employers), the WBSO entails a reduction in the wage tax to be paid for its employees conducting R&D activities. In 2022, this so-called ‘R&D remittance reduction’ is 32% of the R&D base up to € 350,000, and 16% thereafter. If you qualify as a ‘starter’ (i.e. you employ people for less than 5 years and were granted the WBSO-statement for <3 calendar years), you are eligible for an R&D remittance reduction of 40% over the first € 350,000.
R&D Base
Regular
Starter
€0 till €350,00
32%
40%
From €350.000
16%
16%
The R&D base – which functions as the basis for the wage remittance reduction – can be calculated in two ways:
Method 1: based on the number of R&D hours: this is the more straightforward regime, where the amount is calculated based on the number of hours granted, with an average hourly wage of € 29 plus an additional amount of € 10 per R&D-hour (up till 1,800 R&D hours) and € 4 for any additional hours on top of the 1,800 hours.
Method 2: based on the actual costs and expenses that relate to the R&D activities.
In case you would like to calculate the potential WBSO-benefit yourself, feel free to use our open-source Excel-file. You can download the Excel file here:
1.2 The number of R&D hours: choose a reasonable number!
A WBSO-statement always applies to any future R&D work performed by the company. As a result, you will need to make a forecast of the number of R&D hours you are planning on spending (method 1).
Make sure to apply for a reasonable number of R&D hours. The reason is that the RVO 1) checks whether the number of R&D hours requested isproportionate to the project and the amount of FTE involved, and 2) the RVO regularly audits companies on their number of R&D hours spent. In case the number of R&D hours for which you applied cannot be justified, you risk a correction and a fine.
1.3 ‘But…our R&D project is not that innovative.’
While analyzing the R&D activities of a potential WBSO-applicant, we sometimes notice that the company itself does not consider the project to be ‘innovative’. In most cases this is caused by 1) R&D employees perceiving the R&D work as ‘simple’ due to them being experts in their respective field, or 2) comparing the R&D activities/ the unfinished product to the (finalized) product of a competitor. Though we understand that this might seem problematic when filing a WBSO-application, we would like to stress that both these factors are completely irrelevant for WBSO-purposes. The only relevant factor when determining if a project qualifies for WBSO-purposes is whether you aim to solve a technical bottleneck that cannot be solved by any known methods. It is therefore irrelevant if this work is perceived as simple by the R&D employees or whether a competitor has already solved this bottleneck. For instance: the RVO will not reject a WBSO-application in case you are planning on solving a technical bottleneck for a new ‘Google-like’ search engine, just because Google itself might have a way of solving the technical bottleneck. What isn’t considered R&D work – and will not qualify for WBSO-purposes – is using existing technologies to solve technical bottlenecks. For example: creating a machine learning model by utilizing certain libraries (such as Tensorflow) will not qualify as R&D work, but developing a machine learning model from scratch (and solving a technical bottleneck in the process) will.
2. The profit side: the innovation box
The Dutch innovation box is a special corporate income tax regime for companies who generate profit via a self-developed intangible asset. Any profits that fall under the scope of the innovation box are effectively taxed at a corporate income tax rate of ~9% instead of the statutory rates of up to 25.8%.
2.1 The requirements: the WBSO and a patent/plant breeders’ right (in Dutch: Kwekersrecht).
The Dutch corporate income tax act differentiates between so-called small-sized companies and larger-sized companies. The requirements a company needs to meet in order to apply for the Dutch innovation box vary depending on its size. For the small-sized companies, the application can be filed as soon as a WBSO-statement is issued by the Dutch Enterprise Agency. Larger-sized-companies require a patent or a so-called plant breeders’ right (in Dutch: Kwekersrecht).
A company qualifies as a ‘small-sized company’ if:
The total gross margin of the company that relates to the intangible asset is ≤ € 37.5 million in the last 5 years (i.e. the sum of the last 5 years).
The total turnover of the company is ≤ € 250 million in the last 5 years (i.e. the sum of the last 5 years).
2.2 Four methods to determine the profit subject to the innovation box
The innovation box benefit can be calculated via four methods:
The peel-off method (‘afpelmethode’).
The cost-plus method.
The single- intangible asset method (‘per activum’).
The flat rate method.
Which method is best suited for your business depends on your business model as well as the role R&D fulfills within your company. In practice, a functional analysis of your company will determine which method is most suited and which percentage of the profit is subject to the innovation box scheme. For completeness’ sake, we would like to note that it is a common misunderstanding that 100% of a company’s profits can attributed to the innovation box. Even the most high-tech companies in which R&D is interwoven in their entire business process cannot allocate all of their profits to the innovation box scheme. The tax authorities will – in such a case – always consider a part of the profits to be allocable to an entrepreneurship-like function within a company.
2.2.1 The peel-off method (in Dutch: ‘afpelmethode’).
In case R&D is a core activity within your company and the profits that relate to an intangible asset cannot be determined on a stand-alone basis, the peel-off method is the most suited method. The peel-off method is – in most cases – the most beneficial way of determining the innovation box profit, as the entire EBIT (‘Earnings before interest and tax’) of the company will be considered the starting point. This method works by allocating a small part of the profits to the more routine-like functions within the company. The remainder of the profits is then allocated to the core divisions/functions within the company. In a way: you are ‘peeling off’ the company’s functions layer by layer.
An example of the peel-off method allocation per core-division would be:
Entrepreneurship
20%
Sales
10%
Production
30% +
Total:
60%
Attributable to R&D
40% +
Total:
100%
In the above example, 40% of the company’s profits are allocable to innovation, and will therefore be taxed against an effective corporate income tax rate of ~9%.
2.2.2 When is R&D considered to be a core activity?
Well, that depends on the activities of the company. The Dutch tax authorities will take the position that the peel-off method is the most suited method if the R&D-activities are an essential part of the day-to-day operations. This is the case if R&D activities are interwoven in all of the company’s operations and the R&D function is one of the most important functions in terms of value creation for the company.
2.2.3 How do we determine the percentages attributable to each division/activity when applying the peel-off method?
When applying the peel-off method, a functional analysis determines which part of the profits is allocable to each division/function. The exact percentage per division depends on the size of the company (smaller or larger size), the industry and the function R&D fulfills within the company. Factors that may be relevant in this analysis are:
The number of WBSO-hours.
The intertwinement of R&D within the different business units of the company.
The different types of products/service lines within the company.
2.2.4 The hurdle – development costs
It is important to note that the innovation box regime contains a hurdle for the development costs that relate to the development of the intangible asset. In short: the innovation box regime will only be applicable if the development costs for the intangible are compensated by the profits generated by said intangible. The goal here is to prevent a deduction of development costs against the standard corporate income tax rate of 25,8% (maximum), while the profits are taxed against an effective tax rate of ~9%.
2.3 The cost-plus method
In case innovation is not considered a core-activity within the company but rather complementary to the company’s core activity, the Dutch tax authorities may take the position that the innovation box profits should be determined on a cost-plus basis.
The cost-plus method entails adding a mark-up on all costs (direct & indirect) relating to the R&D work. This mark-up is determined by benchmarking the remuneration an independent third party would receive for these R&D activities.
Under normal circumstances, a mark-up between 8% – 15% is accepted by the Dutch tax authorities.
2.4 The single intangible asset method
The single intangible asset method is very similar to the peel-off method. When applying the single intangible asset method, the operational profit needs to be divided between routine functions and core activities/divisions of the company. The difference here is that – while the peel-off method considers the EBIT (‘earnings before interest and tax’) as the starting point – the single intangible asset method only takes the development costs and the ‘benefits’ that directly relate to the intangible asset into account. The single intangible asset method is generally used to calculate the innovation box profits in royalty structures, where there is a direct and easily identifiable revenue stream that relates to the intangible asset.
Note that – same as for the peel-off method – a hurdle based on the development costs applies.
2.5 The flat rate method
In the event that the earlier described methods are deemed to be too complex, there is always the possibility of utilizing the flat rate method. Based on this method, 25% of the profit will fall under the scope of the Dutch innovation box. The benefit is however capped to € 25,000 on a yearly basis, making this – in most cases – only a viable option for a small/ start-up company.
2.6. The corporate income tax benefits
Although it may seem a bit nitty gritty, it is important to note that the innovation box benefit is actually a tax base exemption -rather than a tax rate reduction- calculated via the following formula: (16/25.8) x innovation box profits (2022). This exemption results in an effective tax rate of ~9% for any profits that are subject to the innovation box scheme. It also results in an additional – and in most cases unforeseen – benefit that the innovation box scheme ‘extends’ the first corporate income tax bracket.
2.6.1 Extending the first corporate income tax bracket and further reducing the effective tax rate
Besides the fact that the innovation box reduces the effective tax rate of profits that fall within its scope, the innovation box also positively influences the remainder of the profits. This is a result of the fact that the remainder of the profits (i.e. part of the profits that are not subject to the innovation box) are taxed against the regular, below-mentioned corporate income tax rates.
Taxable profit (2022)
Tax rate
€ 0 till € 395,000
15%
From € 395,000
25.8%
Consequently, the remaining profits will first be taxed in the first bracket at a tax rate of 15% up to € 395.000, thus further reducing the effective tax rate. In case you are wondering how this would affect the effective tax rate of your organization, feel free to use our Excel-file which shows you the effective tax rate depending on the taxable profit and the innovation box percentage. Note that we based this Excel file on the peel-off method. You can download our Excel file here:
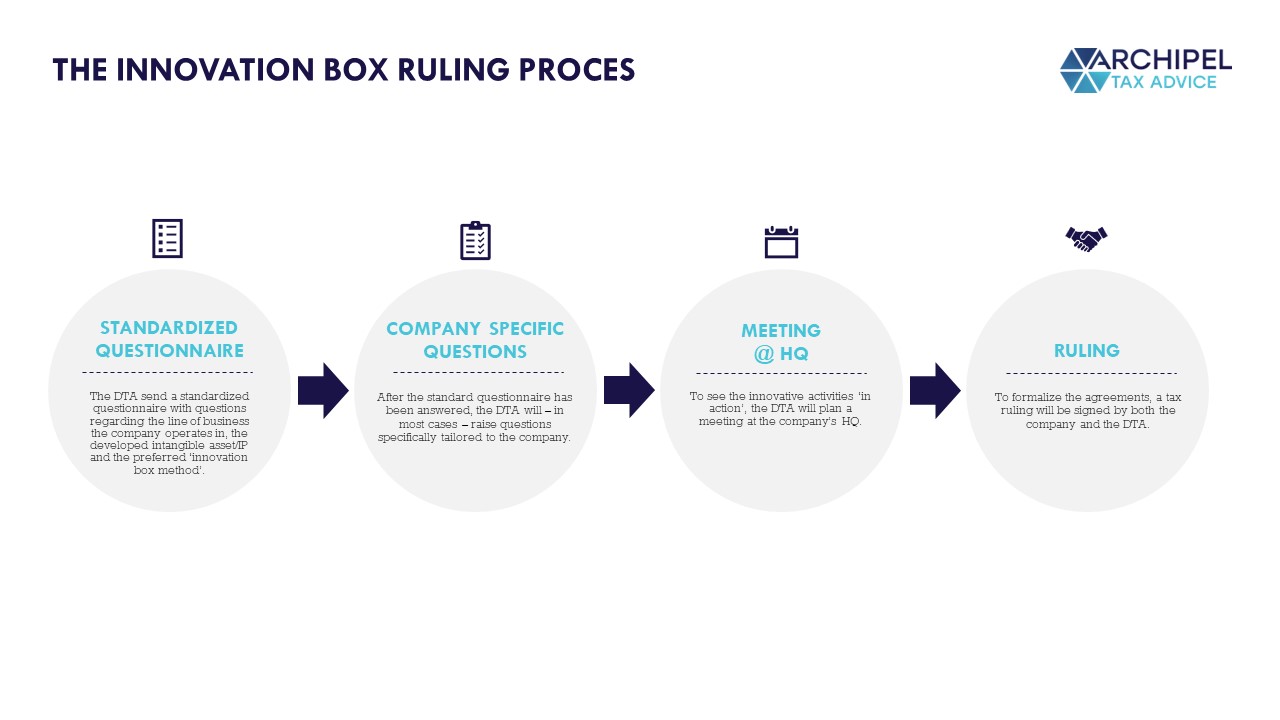
The innovation box ruling process starts with a ruling application request. Once filed, the Dutch tax authorities will send over a standardized letter containing several questions to get to know the applicant. These questions relate to: 1) the line of business in which the company operates, 2) the intangible asset/ intellectual property developed by the company and 3) the preferred method to determine the innovation box profit. In most cases, the Dutch tax authorities will request a company specific questionnaire following the initial application. Once the Dutch tax authorities have a clear initial image of the company’s business, they will plan a meeting at the company’s HQ. This meeting is meant to help the Dutch tax authorities understand how the business operates and what role R&D fulfills within the company. After the meeting, the Dutch tax authorities and the company will conclude a tax ruling . The ruling will contain:
a description of the company;
a description of the R&D activities;
the method to determine the innovation box profit.
To further specify which part of the profits will be subject to the innovation box scheme, an addendum to the ruling request will be concluded, based on the company’s commercial forecasts. The ruling will be concluded for a period of 5 years.
Click on the image for a larger version.
4. FAQ
4.1 Can I outsource some of the R&D that contributes to my intangible asset?
You are able to outsource some of the R&D work as long as the costs that relate to the R&D work (as well as any potential risks) are borne by the innovation box applicant.
4.2 Does this mean that I can outsource the R&D work to an affiliated entity?
Outsourcing to an affiliated entity is possible, but may impact the total innovation box benefit. The Dutch corporate income tax act contains a limitation on the innovation box benefits that relate to the outsourcing of R&D work to an affiliated entity. The reason is that – in most cases – affiliated entities are able to structure their R&D activities between different jurisdictions. To mitigate any unwanted tax structuring which might arise in such a case, the innovation box benefits will be limited based on the following formula:
Qualifying innovation box benefits =
Qualifying expenses X 1,3
________________________
Total expenses
X benefits
In the above formula, the outsourced R&D expenses to an affiliated entity are not considered ‘qualifying expenses’. As a result, a maximum of 30% of the expenses can be outsourced to an affiliated entity without it impacting the innovation box benefits.
4.3 An Innovation box ruling is concluded for a period of 5 years, what if my corporate structure/ my business model unexpectedly changes during this time?
Every tax ruling contains a clause stating that the ruling remains valid as long as the relevant facts and circumstances do not change. In such a case, you are obligated to notify the Dutch tax authorities accordingly. This may result in the termination of the current ruling.
4.4 I filed a WBSO-request for 2.000 R&D hours. In reality, my company conducted > 2000 R&D hours. Can I file a new WBSO-application to retroactively receive a wage remittance reduction for these additional R&D hours?
Unfortunately, it is not possible to file a WBSO-application to retroactively receive a wage remittance reduction for any additional R&D hours. As a WBSO-application does need to be filed on a yearly basis however, you are therefore able to file a new request next year. For completeness’ sake, we note that you are obligated to notify the Dutch Enterprise Agency in case you spend less than the requested number of R&D hours. As a result, the wage remittance reduction will be reduced accordingly.
4.5 So, the Dutch tax authorities agree to allocate 15% of my EBIT to the Dutch innovation box. Does this mean I can allocate 15% of my EBIT right of the bat?
While concluding an innovation box ruling, the Dutch tax authorities may consider an start-up phase to be present. The duration depends on the innovation type as well as the business structure. As soon as this period ends, you are able to allocate the full amount – 15% of the EBIT – to the Dutch innovation box. For example: in case you conclude a start-up phase of 3 years and an R%D percentage 15%, you will receive an innovation box allocation of 5% in the first year of the ruling, 10% in the second year and finally 15% in the third year.
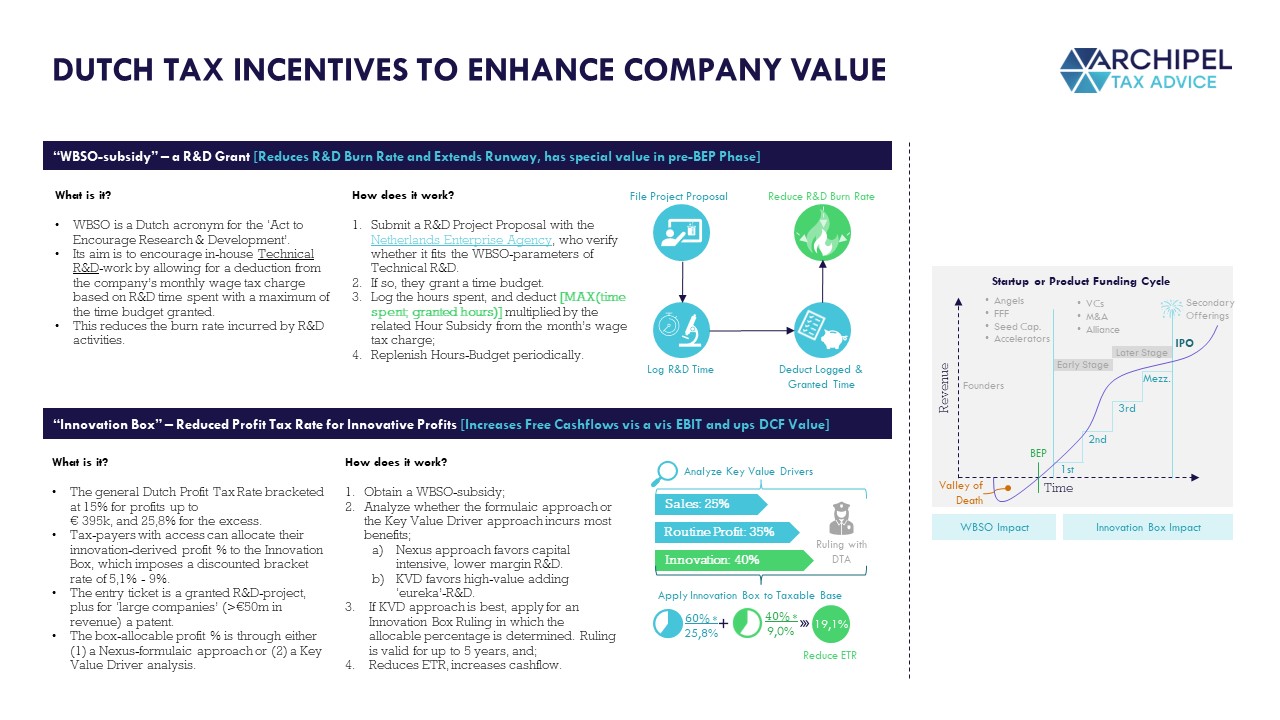
5. Combine the WBSO and innovation box for an enhanced investment case and company value
Where R&D-cycles generally see any revenues being proceeded by a cost-burning phase, a cost-side tax benefit can logically make an R&D project more feasible, as it (1) reduces the burn rate and (2) lengthens the runway. The WBSO does exactly that and therefore provides great value in the ‘pre Break Even Point’ phase.
Investors investing in ‘post-BEP phase’ companies are generally enticed into the high-risk financing of an R&D cycle by the calculation of (1) the chance of success * (2) the rate of return. As the investor rate of return is influenced heavily by profit tax functions, the innovation box can make an R&D project in the post-BEP phase more feasible as well since it increases the outlook of factor (2).
By combing both the WBSO and subsequently the innovation box, a more attractive investment case can thus be achieved.
Click on the image for a larger version
Interested in applying the WBSO and/or innovation box to your company? Book a timeslot with us below, it’s on the house!
Today, the EU Commission and the High Representative put forward an Action Plan on Military Mobility 2.0 and a Joint Communication on an EU cyber defence policy to address the deteriorating security environment following Russia’s aggression against Ukraine and to boost the EU’s capacity to protect its citizens and infrastructure.
In particular, the Action Plan on Military Mobility will help European armed forces to respond better, more rapidly and at sufficient scale to crises erupting at the EU’s external borders and beyond. It will bolster the EU’s ability to support Member States and partners as regards transport of troops and their equipment. It works towards better connected and protected infrastructure, while streamlining regulatory issues. It will reinforce cooperation with NATO and promote connectivity and dialogue with key partners.
Building on the achievements of the first Action Plan launched in 2018, the new Military Mobility covers the period 2022-2026 and includes:
Identification of possible gaps in the infrastructure, informing future actions to prioritise improvements and integrate fuel supply chain requirements, to support short-notice large-scale movements of military forces;
Digitalisation of administrative processes related to customs logistics and military mobility systems;
Measures to protect transport infrastructure from cyber-attacks and other hybrid threats;
Promoting access to strategic lift capabilities and maximising synergies with the civilian sector to enhance the mobility of the armed forces, especially by air and sea;
Enhancing the energy efficiency and climate resilience of transport systems;
Reinforcing cooperation with NATO and key strategic partners, such as the US, Canada and Norway, while promoting connectivity and dialogue with regional partners and enlargement countries, such as Ukraine, Moldova and the Western Balkans.
To ensure a well-connected, capable and secure military mobility network, the European Commission is supporting the Action Plan with funding instruments such as the Connecting Europe Facility (funding dual-use transport infrastructure projects), and the European Defence Fund (supporting the development of interoperable logistical and digital systems).
Background
The first Action Plan on Military Mobility was launched in 2018 to strengthen the EU Common Security and Defence Policy. It aimed to ensure swift and seamless movement of military personnel, materiel and assets – including at short notice and at large scale – within and beyond the EU. It helped to create a well-connected network, with shorter reaction times and capable, secure and resilient transport infrastructure and capabilities.
The new Action Plan on Military Mobility responds to the call in the Strategic Compass to enhance the military mobility of our armed forces within and beyond the Union following Russia’s military aggression against Ukraine. This urgent need was also reflected in the Joint Communication on defence investment gaps adopted in June 2022.
Military Mobility is supported through other defence initiatives, notably through the Permanent Structured Cooperation (PESCO) Military Mobility project and Logistical Hubs project. The European Defence Agency’s programme on “Optimising Cross-Border Movement Permission procedures in Europe” and the Coordinated Annual Review on Defence (CARD) also contribute to the effort.
Together with the Security and Defence package, the Commission is also publishing today the first progress report on the Action Plan on synergies between civil, defence, and space industries, available here.
Compliments of the European Commission.
The post Military Mobility: EU proposes actions to allow armed forces to move faster and better across borders first appeared on European American Chamber of Commerce New York [EACCNY] | Your Partner for Transatlantic Business Resources.
Today, the Commission presented a proposal to reduce air pollution from new motor vehicles sold in the EU to meet the European Green Deal’s zero-pollution ambition, while keeping vehicles affordable for consumers and promoting Europe’s competitiveness.
Road transport is the largest source of air pollution in cities. The new Euro 7 standards will ensure cleaner vehicles on our roads and improved air quality, protecting the health of our citizens and the environment. Euro 7 standards and CO2 emission standards for vehicles work hand-in-hand to deliver air quality for citizens, as notably the increased uptake of electric vehicles also creates certain air quality benefits. The two sets of rules give the automotive supply chain a clear direction for reducing pollutant emissions, including using digital technologies.
The new Euro 7 emission standards will ensure that cars, vans, lorries and buses are much cleaner, in real driving conditions that better reflect the situation in cities where air pollution problems are largest, and for a much longer period than under current rules. The proposal tackles emissions from tailpipes as well as from brakes and tyres. It also contributes to achieving the new stricter air quality standards proposed by the Commission on 26 October 2022.
While CO2 emission rules will drive the deployment of zero-emission vehicles, it is important to ensure that all vehicles on our roads are much cleaner. In 2035, all cars and vans sold in the EU will have zero CO2-emissions. However, in 2050, more than 20% of cars and vans and more than half of the heavier vehicles in our streets are expected to continue to emit pollutants from the tailpipe. Battery electric vehicles also still cause pollution from brakes and microplastics from tyres.
Euro 7 rules will reduce all these emissions and keep vehicles affordable to consumers.
The new requirements based on the Euro 7 standards:
The proposal replaces and simplifies previously separate emission rules for cars and vans (Euro 6) and lorries and buses (Euro VI). The Euro 7 standards rules bring emission limits for all motor vehicles, i.e., cars, vans, buses and lorries under a single set of rules. The new rules are fuel- and technology-neutral, placing the same limits regardless of whether the vehicle uses petrol, diesel, electric drive-trains or alternative fuels. They will help to:
Better control emissions of air pollutants from all new vehicles: by broadening the range of driving conditions that are covered by the on-road emissions tests. These will now better reflect the range of conditions that vehicles can experience across Europe, including temperatures of up to 45°C or short trips typical of daily commutes.
Update and tighten the limits for pollutant emissions: limits will be tightened for lorries and buses while the lowest existing limits for cars and vans will now apply regardless of the fuel used by the vehicle. The new rules also set emission limits for previously unregulated pollutants, such as nitrous oxide emissions from heavy-duty vehicles.
Regulate emissions from brakes and tyres: the Euro 7 standards rules will be the first worldwide emission standards to move beyond regulating exhaust pipe emissions and set additional limits for particulate emissions from brakes and rules on microplastic emissions from tyres. These rules will apply to all vehicles, including electric ones.
Ensure that new cars stay clean for longer: all vehicles will need to comply with the rules for a longer period than until now. Compliance for cars and vans will be checked until these vehicles reach 200,000 kilometres and 10 years of age. This doubles the durability requirements existing under Euro 6/VI rules (100,000 kilometres and 5 years of age). Similar increases will take place for buses and lorries.
Support the deployment of electric vehicles: the new rules will regulate the durability of batteries installed in cars and vans in order to increase consumer confidence in electric vehicles. This will also reduce the need for replacing batteries early in the life of a vehicle, thus reducing the need for new critical raw materials required to produce batteries.
Make full use of digital possibilities: Euro 7 rules will ensure that vehicles are not tampered with and emissions can be controlled by the authorities in an easy way by using sensors inside the vehicle to measure emissions throughout the lifetime of a vehicle.
Next Steps
The Commission’s proposal will be submitted to the European Parliament and the Council in view of its adoption by the co-legislators.
Background
Road transport is the largest source of air pollution in cities. In 2018, more than 39% of NOx and 10% of primary PM2.5 and PM10 emissions in the EU came from road transport. These percentages are much higher in cities, where transport is regularly the main contributor to air pollution. It is estimated that road transport caused about 70 000 premature deaths in the EU-28 in 2018.
In 2035, Euro 7 will lower total NOx emissions from cars and vans by 35% compared to Euro 6, and by 56% compared to Euro VI from buses and lorries. At the same time, particles from the tailpipe will be lowered by 13% from cars and vans, and 39% from buses and lorries, while particles from the brakes of a car will be lowered by 27%.
Following the Dieselgate scandal, the Commission has introduced new tests to measure emissions on the road (the RDE method) and increased the market surveillance powers of Member States and the Commission, in order to ensure that vehicles are as clean as expected by the Euro 6 norms.
The rules on pollutant emissions are complementary to the rules on CO2 emissions. The agreed target for 100% CO2 reduction by 2035 for cars and vans has been taken into account in this proposal. The Commission will review in the coming months the CO2 standards for lorries and buses.
Compliments of the European Commission.
The post EU Commission proposes new Euro 7 standards to reduce pollutant emissions from vehicles and improve air quality first appeared on European American Chamber of Commerce New York [EACCNY] | Your Partner for Transatlantic Business Resources.
We need to intensify the greening of our economies despite the energy crisis. Hastening the process will reduce the costs of transition and help to ensure price stability in the long run. This is the third post in a series of climate-related entries on the occasion of COP27.
The current energy crisis has sent gas and electricity prices skyrocketing and brought the potential challenges and opportunities of the green transition into sharper relief. Does that mean that the green transition must now wait until the current crisis is resolved? The answer is firmly no. Humanity must act today to mitigate the devastating effects of climate change[1] and the earlier the green transition takes place, the lower the ultimate costs will be. For central banks globally, fighting climate change and fighting inflation can go hand in hand. The ECB Blog explains why.
The unexpectedly sharp increase in fossil fuel prices, in particular after the Russian invasion of Ukraine, has generated substantial uncertainty. The high energy prices have eaten into households’ real income and business profitability, which makes investing in low-carbon technologies and activities difficult for now. European governments have provided substantial subsidies to businesses and households to cushion the impact of energy price rises. At the same time, they have scrambled to secure energy supplies, undertaking substantial investment in fossil-fuel infrastructure. That includes re-opening mothballed coal-fired plants and constructing liquefied natural gas terminals.
These actions risk hindering the green transition. New fossil fuel infrastructure can reinforce reliance on, and lock in usage of, carbon-intensive fuels. Broad-based energy price subsidies mask the price signals given by the relatively more expensive fossil fuel prices compared with other products including clean energy. Yet, these relative price changes are needed to incentivise lower consumption of fossil fuels, behavioural changes and greater investment in green technology. Broad-based energy subsidies also risk burdening public finances. Government support instead needs to be made temporary and better targeted towards vulnerable households and small businesses, while preserving relative price signals.
Hastening the shift towards a green economy
The current situation also offers opportunities to hasten the green transition. The shortage of energy has brought home the urgent need to reduce reliance on fossil fuels and to foster energy efficiency. Recently made policy proposals such as RePowerEU, even if not sufficient, point in the right direction.[2] Challenges remain related to their implementation, though.
In the medium term, and once pressure on fossil fuel prices eases, governments should price in the negative effects of carbon more effectively. Already committing today to a gradual and predictable future increase in carbon taxes would allow households and businesses to timely prepare. Besides, pricing carbon would provide an incentive to steer financial flows towards green energy sources and low-carbon production and offers governments revenues to support these investments. The green transition is ultimately a question of structural transformation. It cannot happen without green investment.
Price stability and the green transition
Advancing the green transition is not necessarily at odds with price stability. Gradual relative price changes caused by carbon taxes do not inevitably result in higher headline inflation. This is especially true when accompanied by green technological advances and higher energy efficiency.[3] That said, the overall impact of the green transition on inflation is highly uncertain and depends on many factors, including the climate actions taken and the policy responses made.
Increasing the share of renewables can reduce total energy prices in the long run, while also supporting energy security. The price of wind and solar power has plummeted in the past decade due to technological improvements and economies of scale and is now substantially cheaper than fossil fuels. The EU aims to increase the share of renewables. For example, renewables are supposed to account for 45% of gross final energy consumption by 2030 according to REPowerEU.[4] This will help to unwind the recent spike in energy prices and reduce the malign influence of fossil fuels on inflation volatility in the long run.[5]
Chart 1
Fossil fuel prices drive inflation
Annual percentage changes and percentage point contributions
Sources: Eurostat and ECB calculations.
Latest observation: September 2022. The series “other” includes heat energy and solid fuel. and notes
Likewise, an environment of price stability is important for the green transition. Anchoring longer-term inflation expectations at the central bank’s target helps contain long-run financing costs and is conducive to investment in green technologies in the long run.
By contrast, failure to advance the green transition poses risks for price stability. Climate extremes such as droughts or floods can damage infrastructure, ravage harvests, and disrupt supply chains. This can affect the prices of key products and drive inflation volatility.[6] These impacts will only be magnified if we fail to achieve the objectives of the Paris Climate Agreement of limiting global warming to 2°C and making efforts to keep it below 1.5°C.
Government must drive the green transition
The principal responsibility for driving the green transition lies with governments, particularly through properly pricing the negative effects of carbon. But they also have the tools to dismantle the regulatory barriers that currently impede the uptake of renewable energy and to catalyse innovation and investment in green technology.
Now is the time to redouble our collective efforts and hasten along the path of decarbonisation.
The ECB is committed within its mandate to account for climate change. In doing so, it supports the green transition, which will reduce risks to price stability in the long run. We have already made significant progress in implementing our climate change action plan and we will continue to do so.[7]
A well-planned green transition goes hand in hand with energy security and can also contribute to price stability in Europe. Now is the time to redouble our collective efforts and hasten along the path of decarbonisation.
Authors:
Irene Heemskerk
Carolin Nerlich
Miles Parker
Compliments of the European Central Bank.
1. Intergovernmental Panel on Climate Change (2022), Climate Change 2022: Impacts, Adaptation and Vulnerability, contribution to IPCC Sixth Assessment Report.
2. See the European Commission proposal on the REPowerEU Plan.
3. Ferrari, A. and V. Nispi Landi (2022), “Will the green transition be inflationary? Expectations matter”, ECB Working Papers, No. 2726, European Central Bank. Ferdinandusse, M., Kuik, F., Müller G. and C. Nerlich (2022), “Model-based analysis of the short-term impact of increasing the effective carbon tax on euro area output and inflation”, ECB Economic Bulletin, Box 2, Issue 6; Konradt, M. & B. Weder di Mauro (2021), “Carbon Taxation and Greenflation: Evidence from Europe and Canada”, CEPR Discussion Papers, No. 16396, Centre for Economic Policy Research.
4. Discussions are still on-going between the Commission, the Council and the European Parliament.
5. Oil and energy prices have historically played an outsized role in driving global inflation volatility, see, for example, Choi, S. et al. (2018), “Oil prices and inflation dynamics: Evidence from advanced and developing economies”, Journal of International Money and Finance, Vol. 82, Issue C, pp: 71-96; Parker, M. (2016), “How global is ‘global inflation’?”, Journal of Macroeconomics, Vol. 58, pp: 174-197.
6. Parker, M. (2018), “The impact of disasters on inflation”, Economics of Disasters and Climate Change, Vol. 2, Issue 1, pp. 21-48; Faccia, D., Parker, M. & L. Stracca (2021), “Feeling the heat: extreme temperatures and price stability”, Working Paper Series, No. 2626, European Central Bank; Feng, A. & H. Li (2021), “We are all in the same boat: cross-border spillovers of climate risk through international trade and supply chain”, IMF Working Papers, No. 2021/013, International Monetary Fund.
7. See press release on the action plan on 8 July 2021 and the press release on further steps to incorporate climate change into its monetary policy operations on 4 July 2022.
The post ECB | Turning down the heat: how the green transition supports price stability first appeared on European American Chamber of Commerce New York [EACCNY] | Your Partner for Transatlantic Business Resources.