

EACC

World Bank | Joint Statement by the Heads of the International Energy Agency, International Monetary Fund, and World Bank Group

 The Heads of the International Energy Agency, International Monetary Fund, and World Bank Group have agreed to form a coordination group to maximize their institutions’ response to the energy and economic impacts of the war in the Middle East. They issued the following joint statement:
The Middle East war has caused major disruptions to lives and livelihoods in the region and triggered one of the largest supply shortages in global energy market history. The impact is substantial, global, and highly asymmetric, disproportionately affecting energy importers, in particular low-income countries. It is already transmitted through higher oil, gas and fertilizers prices, and is triggering concerns about food prices as well. Global supply chains—including of helium, phosphate, aluminum, and other commodities—are affected, as is tourism due to flight disruptions at key Gulf hubs. The resulting market volatility, weakening of currencies in emerging economies, and concerns about inflation expectations raise the prospect of tighter monetary stances and weaker growth.
At these times of high uncertainty, it is paramount that our institutions join forces to monitor developments, align analysis, and coordinate support to policymakers to navigate this crisis. This is especially the case for countries that are most exposed to the downstream impacts from the war and those confronting more limited policy space and higher levels of debt. To ensure a coordinated response, we have jointly agreed to form a group that will:
(i)  Assess the severity of impacts across countries and regions through coordinated data sharing on energy markets and prices, trade flows, fiscal and balance of payments pressures, inflation trends, export restrictions of key commodities, and supply chain disruptions.
(ii)  Coordinate a response mechanism that may include: targeted policy advice, assessment of potential financing needs and related provision of financial support (including through concessional financing), and use of risk mitigation tools as appropriate.
(iii)  Mobilize relevant stakeholders, including other multilateral, regional, and bilateral partners, to deliver a coordinated and efficient support to countries in need.
The group will work with, and draw on, other international organizations’ expertise as needed.
We are committed to working together to safeguard global economic and financial stability, strengthen energy security, and support affected countries and people on their path to sustained recovery, growth, and job creation through reforms.

About the International Energy Agency
The International Energy Agency, the global energy authority, was founded in 1974 to help its Member countries coordinate collective responses to major oil supply disruptions. Its mission has expanded and evolved since, and rests today on three main pillars: working to ensure global energy security; expanding energy cooperation and dialogue around the world; and supporting a secure, affordable and sustainable energy future. For more information, visit https://www.iea.org/.
About the International Monetary Fund
The IMF is a global organization that works to support economic growth and prosperity for all of its 191 member countries. It does so by supporting economic policies that promote financial stability and monetary cooperation, which are essential to increase productivity, job creation, and economic well-being. The IMF is governed by and accountable to its member countries. For more information, visit  https://www.imf.org
About the World Bank Group
The World Bank Group works to create a world free of poverty on a livable planet through a combination of financing, knowledge, and expertise. It consists of the World Bank, including the International Bank for Reconstruction and Development (IBRD) and the International Development Association (IDA); the International Finance Corporation (IFC); the Multilateral Investment Guarantee Agency (MIGA); and the International Centre for Settlement of Investment Disputes (ICSID). For more information, please visit www.worldbank.org, ida.worldbank.org/en/home, www.miga.org, www.ifc.org, and www.icsid.worldbank.org.The post World Bank | Joint Statement by the Heads of the International Energy Agency, International Monetary Fund, and World Bank Group first appeared on European American Chamber of Commerce New York [EACCNY] | Your Partner for Transatlantic Business Resources.
EACC

ECB | Europe’s Fossil Fuel Dependence Poses Risks to Price Stability

Blog | Europe’s energy dependence increasingly complicates the task of maintaining price stability. Meeting the continent’s clean‑energy targets would weaken the link between volatile global markets and domestic prices. Crucially, the tools to make this transition are already within reach.
Europe’s energy dependence has become one of the critical vulnerabilities of our economy. Recent energy price shocks have transferred vast resources out of Europe, prompted emergency interventions and strained public finances. These costs are real, recurring and largely wasted.
Energy policy is the responsibility of elected governments, and rightly so. But Europe’s energy dependence also has profound implications for the ECB. Our primary mandate is price stability. Yet repeated energy price shocks make achieving this objective increasingly difficult.
Why do central banks care?
Europe remains among the advanced economies most reliant on imported fossil fuels. This vulnerability was starkly exposed following Russia’s unjustified invasion of Ukraine, when energy prices surged, pushing euro area inflation up to 10.6% in October 2022 and giving rise to what some aptly described as “fossilflation”.
Recent geopolitical tensions have highlighted how little this dependence has changed, with the conflict in the Middle East triggering another surge in European energy costs. The March 2026 ECB staff macroeconomic projections outline how this external shock could increase inflation and decrease growth.
This is a complex scenario for us to manage. Tightening monetary policy to contain inflation can deepen an economic slowdown, while loosening policy to support growth can entrench inflation.
In theory, central banks can look through temporary supply shocks, provided they do not spill over into broader and more persistent price pressures, inflation expectations remain anchored and wage-price spirals do not emerge. But repeated and persistent energy shocks test all these conditions, as ECB President Christine Lagarde highlighted in her recent speech.
Transition now – or pay more later
Europe cannot eliminate geopolitical risk, but it can significantly reduce its exposure to it. The most effective way to do that is by cutting reliance on imported fossil fuels and accelerating an orderly shift to home‑grown clean energy. If Europe were to meet its sustainable energy targets, the link between domestic energy prices and volatile global energy markets would weaken substantially.
Spain’s transition to renewable energy demonstrates the benefits of clean energy investment: estimates from the Banco de España indicate that wholesale electricity prices in early 2024 were approximately 40% lower than they would have been had wind and solar generation remained at 2019 levels.
Broader implementation of these strategies would mean fewer shocks to households, firms, public finances and financial markets – and ultimately greater macroeconomic and price stability.
Some argue that such a transition is prohibitively expensive. It is true that according to the European Commission, investment will need to reach around €660 billion per year between 2026 and 2030. But focusing only on these costs is profoundly misleading.
Investing in clean, sustainable energy replaces substantial spending on fossil fuels. Today, Europe spends nearly €400 billion each year on fossil fuel imports. By contrast, the marginal cost of producing home‑grown renewable energy is structurally lower. Once the infrastructure is in place, the energy itself is virtually free.
As a result, the adoption of domestically produced, clean and sustainable energy delivers far more than just climate benefits. It strengthens macroeconomic stability, lowers long‑term costs, supports economic growth, delivers health benefits and enhances Europe’s strategic autonomy – as recently highlighted in a speech by President Lagarde.
New analysis from the UK Climate Change Committee shows that for every pound invested in sustainable energy, the benefits outweigh the costs by a factor of 2.2 to 4.1. So it is no surprise that recent reports, including Mario Draghi’s “The future of European competitiveness”, identify decarbonisation as a core pillar of Europe’s long‑term economic strategy.
The choice is clear, if not easy
Fortunately, the tools needed to make this transition are within reach. It requires large upfront investments, deep and well‑functioning capital markets, and a predictable policy environment. Progress on the savings and investments union will be essential to mobilise capital at the necessary scale.
Policy certainty, combined with the right incentives, is essential to ensure that long-term perspectives are prioritised over short-term gains, and public and private objectives reinforce rather than undermine one another. This starts with delivering on existing decarbonisation targets and preserving the Emissions Trading System as a credible, market‑based instrument for carbon pricing.
None of this is easy. But the real question is no longer whether Europe can afford to make the energy transition. It is whether it can afford not to. From a central banking perspective, the answer is clear.
 
 
Compliments of the European Central Bank The post ECB | Europe’s Fossil Fuel Dependence Poses Risks to Price Stability first appeared on European American Chamber of Commerce New York [EACCNY] | Your Partner for Transatlantic Business Resources.

Read More
EACC

IMF | Global Imbalance: Old Questions, New Answers?

Blog | Widening global current account imbalances are best addressed by simultaneous domestic policy adjustments. Industrial policy and tariffs offer a costly fix with unreliable effects on imbalances.
Global current account imbalances are widening again, reversing a decade of steady decline following the global financial crisis. History suggests a clear risk: widening imbalances have often been accompanied by concentrated and lower-quality growth, triggered sectoral dislocations across trading partners, and preceded financial crises or abrupt reversals of capital flows. With the global economy already absorbing multiple shocks, such a disorderly adjustment could be exceptionally costly.
This renewed widening has revived questions about which policy tools can meaningfully impact external positions. In particular, the recent expansion of industrial policies and the proliferation of trade restrictions have diverse economic and non-economic motives, but are often justified by the objective of reducing current account imbalances. Yet there is limited analytical and empirical clarity on how these policies affect external balances.

Saving and investment
For any economy, the current account reflects the difference between what its people, businesses, and government save and invest. This concept anchors the IMF’s long-standing analytical framework for external sector assessments.
Policies affect the current account to the extent that they alter saving or investment. This depends not just how policies affect activity today, but also how they shift expectations. Personal saving rises when people expect income to decline, and it falls when they expect increased income. Companies invest based on their outlook for returns, not just today’s profitability. This insight is central to understanding why many trade and industrial policies often have limited or counterintuitive impacts on the current account.
We can see how standard macroeconomic policies have driven some of the recent increase in global imbalances: bigger budget deficits and robust consumer spending have lowered saving in the United States, while weaker demand and higher saving in China have followed its real estate slowdown.
Of course, positive or negative current account balances are not inherently undesirable, as they can reflect structural factors such as countries saving more as their population ages. It is also important to bear in mind that the relevant metric for assessing imbalances is the overall current account position of a country against the rest of the world, not bilateral or sectoral balances. Nor are imbalances simply about misaligned exchange rates and price competitiveness. A meaningful diagnosis requires a full macroeconomic assessment of influences on saving and investment, including policy drivers and structural forces.
Policy details matter 
Tariffs have been justified as a way to narrow trade deficits. However, our analysis finds that they have only small and unreliable effects on the current account because they are often perceived as permanent or are frequently retaliated against. In such cases, people do not adjust saving in anticipation of future price changes. The result is a nearly unchanged current account.
There is one important exception: temporary tariffs can raise saving by encouraging people to postpone consumption. In theory, this can increase the current account balance, though such episodes are rare, and empirical evidence suggests the effects are modest and short-lived.
Industrial policies are more diverse—and so are their effects. We distinguish two types of industrial policies: micro, which target specific companies or sectors, and macro, which are economy-wide policies that are often combined with financial or capital account restrictions.
Micro industrial policies—such as subsidies for a specific industry or targeted tax incentives—generally have ambiguous and limited effects on the current account. When they succeed in raising aggregate productivity, they tend to boost investment and consumption, often lowering the current account balance. When they fail, for example by misallocating resources and depressing productivity, they can increase the current account balance, but at the cost of lost output. Either way, large and systematic effects on external balances are uncommon.
Macro industrial policies, by contrast, can have larger effects. These strategies, often associated with export-led growth models, combine foreign asset accumulation, capital flow restrictions, financial repression, or other mechanisms that boost national saving. These policies work not by improving efficiency but by forcing saving, often at the expense of economic welfare. The current account balance increases, but mainly because domestic demand is restrained and resources are redirected toward external surpluses.
The conclusion is clear: industrial policies and tariffs are not shortcuts to external rebalancing. When they affect the current account, they often do so by suppressing consumption or investment—hardly a recipe for sustainable growth. Durable rebalancing still depends on sound domestic policies, not trade barriers.
Future imbalances and output
Applying our findings to the current economic picture, scenario analysis shows that global imbalances could widen further if trends persist. This would reflect continued large fiscal deficits and strong domestic demand in the United States, additional government support to exporters in China alongside weaker safety net provision and consumption, and subdued investment and weak productivity growth in Europe. In this setting, an escalation of tariffs does little to change current account positions, largely because these measures are reciprocated or perceived as permanent, but it does lower output across regions.
By contrast, an alternative scenario anchored in domestic rebalancing—fiscal consolidation in deficit countries, more consumption‑led growth in surplus economies, and productivity‑enhancing investment elsewhere—would narrow global imbalances and raise global output.
This synchronized adjustment would lead to the best outcome for the global economy. The economic drag from US fiscal tightening would be offset by stronger demand from China and Europe. But even if such coordination proves difficult, the best course of action for each country is clear: start addressing domestic imbalances now, regardless of what others do. Delaying adjustment poses a threat to domestic and global economic stability. Unilateral adjustment will also add pressure for other economies to adjust. Stronger domestic demand in China, by lifting global demand, would increase global interest rates and make fiscal adjustment more likely in other regions such as the United States. Fiscal consolidation in the United States could further stoke deflationary forces in China and incentivize efforts to boost consumption.
What is clear is that global imbalances will be shaped by domestic macroeconomic trajectories and policies rather than by tariffs or narrowly targeted industrial policies. It’s also evident that reducing global imbalances works best when countries move together. The IMF, though its analysis, policy advice, and convening power, can help its members move toward this better outcome.
 
 
Compliments of the International Monetary FundThe post IMF | Global Imbalance: Old Questions, New Answers? first appeared on European American Chamber of Commerce New York [EACCNY] | Your Partner for Transatlantic Business Resources.

EACC

ECB |How Banks Are Adjusting to Declining Reserves

As the Eurosystem normalises its balance sheet, central bank reserves – banks’ most liquid asset – keep declining. This post examines how banks adapt to lower levels of reserves and explains why take-up in the Eurosystem’s standard refinancing operations (SROs) is expected to increase.[1]
 
Central bank reserves have almost halved from a peak of €4.9 trillion in 2022 to €2.6 trillion in early 2026 (Chart 1a). While still abundant, they are unevenly spread across banks. This implies that, as the Eurosystem continues to shrink its balance sheet, some banks may need to source reserves sooner than others. At the same time, money market rates at which banks lend and borrow have moved closer to the deposit facility rate (DFR) – the main policy rate through which the ECB steers its monetary policy stance. In fact, secured money market – repo – rates last traded this close to the DFR in 2020. This blog post examines the implications of these trends.
In an annual Eurosystem survey, bank treasurers were asked about the preferred level of reserves they wish to hold. When compared to actual reserve holdings, we find that banks representing 26% of all euro area banking assets now operate close to what was indicated as their preferred level of reserves, up from 15% a year earlier (Chart 1b).[2] The group includes large banks, such as globally systemically important banks (G-SIBs), as well as custodians and asset managers – institutions that generally manage their liquidity more actively.
Looking ahead, reserves are projected to decline by about €470 billion per year, though this projection is subject to high uncertainty (Chart 1a).[3] While at present most banks are still holding abundant reserves, the share of banks nearing their preferred reserve levels is expected to increase. By the end of 2026, banks accounting for 50% of total banking assets are projected to reach their preferred level (Chart 1b). In other words, banks will have to more actively manage their liquidity.

Chart 1
Reserve positions of euro area banks

a) Projected path of reserves

b) Share of banks close to their preferred reserve level

(EUR billions)

(percentage of banking assets)

Sources: ECB (Eurosystem market operations data and the Eurosystem Bank Treasurer Survey for the fourth quarter of 2025).
Notes: The left panel shows the projected path of euro reserves assuming take-up in standard refinancing operations is in line with the median SMA respondent. The uncertainty area around the projections is based on a range of alternative assumptions. The right panel classifies banks by the relative distance between their reserves in fourth quarter of the relevant year and their preferred reserve level indicated in Bank Treasurer Survey. Banks are classified as close to their preferred level if their reserve holdings are within a distance equivalent to 1% of total assets of the reserve target they indicated in the Eurosystem Bank Treasurer Survey. All other banks are classified as banks with abundant reserves. The projection for the fourth quarter of 2026 assumes that the aggregate decline in reserves will continue at the same pace as that observed for each bank business model group between the fourth quarter of 2024 and the fourth quarter of 2025.

As reserves decline, banks will increasingly rely on money markets and the Eurosystem refinancing operations to manage their reserve levels. Those banks that are closer to their preferred reserve levels or their internal regulatory targets will normally be the first to seek liquidity. We are analysing banks’ behaviour in money markets and central bank operations in order to learn how reserves are distributed through the market. We are also investigating how money market rates are evolving and how banks are adapting to the changes to the operational framework for implementing monetary policy announced in March 2024.
Liquidity is being redistributed smoothly
Commercial banks are actively lending and borrowing in money markets, which is redistributing their central bank reserves smoothly across banks and euro area countries. Currently this redistribution is working well – there are no signs of fragmentation. The repo market – the main money market to borrow and lend reserves – is dominated by banks with abundant reserves.[4] These are mainly dealer banks that intermediate liquidity. However, other banks are also becoming increasingly active in the repo market in order to manage their reserve levels (Chart 2). In fact, those closest to their preferred reserve levels borrow the most in the short-term repo market relative to their reserves.

Chart 2
Outstanding gross and net repo borrowing of banks

Sources: ECB (Securities Financing Transactions Data and the Eurosystem Bank Treasurer Survey) and ECB calculations.
Notes: The chart shows the average gross and net outstanding repo positions in 2025 by bank liquidity group. “Term repo” is defined as transactions by euro area banks against any collateral type with a maturity above one month. The bank liquidity groups are banks with reserves close to target (i.e. close to their preferred level); and banks with abundant reserves. For banks with abundant reserves we distinguish between those that are close to either their internal liquidity coverage ratio (LCR) or net stable funding ratio (NSFR) targets. Banks are considered to have optimised their LCR or NSFR if they are within 11 percentage points of their internal LCR target or 5.3 percentage points of their internal NSFR target. These ranges represent the 25th percentile of LCR standard deviations and the 50th percentile of NSFR standard deviations.

Banks are also active in term money markets – a market where they borrow and lend for longer than 30 calendar days. They use this market to manage their compliance with Basel III regulatory standards: the liquidity coverage ratio (LCR) and net stable funding ratio (NSFR). Survey evidence indicates that banks set internal targets above the 100% regulatory minimum for these regulatory ratios and are keen to defend them. When facing liquidity shortfalls, term money markets are typically the first point of access. This market activity has further redistributed reserves across euro area banks and countries, but it has also pushed up premia on term liquidity, as banks close to their regulatory targets increasingly borrow in these markets to fine-tune these ratios. In turn, activity and interest rates in the term segment can act as an early indicator of changing system-wide liquidity needs and as a benchmark for how attractive Eurosystem standard refinancing operations are. Figure 1 illustrates these interactions.

Figure 1
Illustration of the interaction of reserves with regulatory ratios, markets and the central bank

Source: ECB.

Short-term interest rates are close to the deposit facility rate
Overall, short-term market interest rates remain near the ECB’s DFR (Chart 3a). The benchmark rate for unsecured bank borrowing is the euro short-term rate (€STR). Its spread versus the DFR has gradually narrowed. Likewise, secured money market (repo) rates have moved closer to the DFR as collateral has become more abundant and reserves have continued to decline.

Chart 3
Short-term interest rates steered by the deposit facility rate

a) Spread between short-term rates and the DFR

b) Spread between repo rates and the DFR by borrower type

Sources: ECB data (Money Market Statistical Reporting and the Securities Financing Transactions Data) and ECB calculations.
Notes: The left panel shows the spread between the €STR and the DFR as well as the spread between the repo rate and the DFR, 5-day moving average excluding month-ends, where the repo rate is the weighted-average repo rate for one-day trades collateralised by euro area government bonds or other EU bonds. The repo rate is trimmed at the 25th and 75th percentiles. The right panel shows the transaction volume-weighted average repo rate for: borrowing banks that are close to their preferred reserve level; borrowing banks that have abundant reserves (see Chart 1b); and borrowing by hedge funds. The latest observation is for 30 March 2026.

The share of overnight repo trades above the DFR has increased to 40%, but this does not reflect funding pressures for banks. In fact, banks – including those with less abundant reserves – are still borrowing at rates just below the DFR on average (Chart 3b). Instead, repo rates above the DFR mainly reflect cash demand from hedge funds which are willing to pay the spread to fund their investment strategies in other market segments.
Lessons learned from other jurisdictions, i.e. the United States and the United Kingdom, underscore two points. First, money market rates can also be driven by other factors, such as higher collateral supply or higher non-bank demand for cash. And, second, it is not only banks’ reserve needs which can substantially influence money market rates.[5] So rising rates do not necessarily signal increasing scarcity of reserves, but may instead reflect shifts in market structure or funding conditions. In such cases, movements in certain segments of the money markets need to be interpreted with caution, as they may not provide a reliable signal about the overall liquidity environment.
Declining reserves to eventually lift take-up in ECB operations
The demand for Eurosystem SROs remains low so far, because conditions in money markets continue to be favourable. On average, money market rates are largely below the rate on the main refinancing operation (MRO), currently 2.15%, which is 15 basis points above the DFR, now at 2.0% (Chart 4a). Banks can borrow at lower rates in markets than they would have to pay to borrow from the central bank against a broad set of collateral. As a result, the take-up in the ECB’s SROs has remained limited, averaging around €20 billion last year (Chart 4b). In contrast, longer-term market funding (for instance, with tenors of 12 months) is seeing rates above the MRO rate. This reflects its regulatory value, especially for the NSFR, as SRO funding does not count towards this ratio. However, while overall SRO take-up is low, more banks are participating with test bids or for covering temporary liquidity needs. Simply put, there is little urgency to borrow from the ECB as of now, but banks have to ensure operational readiness.
Our survey results show that banks’ incentive to use Eurosystem operations is likely to increase as reserves become scarcer and SROs become more attractive relative to market funding. This means that moving to lower levels of reserves may, all other things being equal, be accompanied by a rise in money market rates.
In the ECB’s operational framework, the SROs are designed to serve as the marginal tool for meeting banks’ liquidity needs. As reserves become less abundant and more banks will approach their preferred levels of reserves, SROs – provided at fixed rates with full allotment – offer a key source of reserves. Also, when money market rates are moving higher, borrowing through SROs and lending into the money market becomes more attractive. In turn, more take-up in SROs will inject reserves into the system, keeping money market rates in check.

Chart 4
Favourable funding conditions in money markets explain low take-up in Eurosystem operations

a) Relative market pricing of borrowing in money markets versus the expected deposit facility rate

b) Use of Eurosystem SROs

Sources: ECB (Money Market Statistical Reporting, Securities Financing Transactions Data, Short-Term European Paper statistics, Survey of Monetary Analysts) and ECB calculations.
Notes: The left panel shows the average difference between each money market rate and the expected DFR implied by the overnight interest swap (OIS) rate with a matching maturity, as an average from July 2025 until 30 March 2026. Repo against high-quality liquid assets (HQLA) collateral – such as euro area government bonds (EGB) – tends not to provide any LCR or NSFR regulatory value irrespective of the trade maturity. The right panel shows the outstanding amount in SROs and the median consensus from the March 2026 Survey of Monetary Analysts. LTRO stands for 3-months longer-term refinancing operation, MRO for main refinancing operation.

Conclusion
More banks are now operating closer to their preferred reserve levels and the euro area financial system has so far adjusted well to declining reserves. Banks are borrowing and lending in the markets effectively, which is helping redistribute reserves smoothly across banks and countries. There are no signs of fragmentation. Short-term interest rates, both secured and unsecured, remain close to the ECB’s DFR. Until now, money market funding conditions have been favourable compared with the terms for borrowing through the SROs. Therefore, banks have met almost all their liquidity needs through the money markets. However, as reserves continue to decline it will be important for banks to be ready to use Eurosystem operations as routine tools to manage their liquidity and to support market-making.
The views expressed in each blog entry are those of the author(s) and do not necessarily represent the views of the European Central Bank and the Eurosystem.

Standard refinancing operations consist of the main refinancing operations (MROs), with a duration of one week, and also the longer-term refinancing operations (LTROs), which have a duration of three months. Both operations provide liquidity upon demand against broad collateral, at the MRO rate and the average MRO rate respectively.

The Eurosystem Bank Treasurer Survey was conducted between 14 and 29 October 2025 with two main objectives: to determine the preferred minimum level of reserves banks aim to maintain under the current economic and financial conditions and to assess the demand for Eurosystem refinancing operations. The survey also investigates what drives demand for central bank reserves and how regulatory requirements interact with that demand.

The path of reserves is calculated based on a projection of the other balance sheet items of the Eurosystem. Banknote growth and non-monetary policy holdings are the main contributors to the uncertainty around the central projection.

Repo refers to repurchase transactions, a type of short-term loan where one party sells a financial asset with a simultaneous commitment to repurchase that asset at a future date. The repo market is therefore also called the secured money market, as borrowing of liquidity (reserves) is secured by collateral (typically government bonds) which the cash lender keeps as insurance should the borrower not repay the loan. Before the global financial crisis, reserves were mainly redistributed via unsecured borrowing and bank lending.

For example, in the United States the Federal Reserve announced the launch of Reserve Management Purchases to stabilise the level of reserves, while in the United Kingdom banks are increasingly borrowing from the Bank of England’s operations, even though reserves remain above the preferred minimum range of reserves. In these jurisdictions, repo rates have experienced upward pressure and mild volatility, which is partly related to demand from non-banks, including hedge funds, and partly to bond supply.


Compliments of the European Central Bank The post ECB |How Banks Are Adjusting to Declining Reserves first appeared on European American Chamber of Commerce New York [EACCNY] | Your Partner for Transatlantic Business Resources.

EACC

European Commission | Questions and Answers on the EU ETS Market Stability Reserve

What is the Commission proposing to change in the EU ETS Market Stability Reserve?

The Commission is proposing to stop the automatic invalidation of ETS allowances held in the Market Stability Reserve (MSR) above 400 million. Instead of being cancelled, these allowances will be retained in the reserve.
This strengthens the MSR’s role as a buffer, improving its ability to respond to future market developments, including situations of supply tightness or excessive price volatility, while preserving the system’s rules-based design.

Why is the Commission proposing updates to the Market Stability Reserve now?

The EU Emissions Trading System(EU ETS) is delivering: it is reducing emissions, cutting Europe’s dependence on imported fossil fuels and driving investment in clean, homegrown energy. At the same time, as recently highlighted by President von der Leyen at the March European Council, it needs to be modernised to remain effective, flexible and responsive to changing market conditions.
The proposed update to the MSR reflects this need. Stopping the invalidation of allowances will strengthen the system’s capacity to act as a buffer and ensure stability in the years ahead. The comprehensive review of the EU ETS, planned for July 2026, will contain that assessment and include any relevant adjustment to keep the MSR fit for purpose in the next decade.
This measure is part of a broader effort to keep the EU ETS fit for purpose, maintaining its core design while strengthening its ability to deliver decarbonisation, competitiveness and energy security.

How will this change affect carbon prices and the functioning of the EU carbon market?

The Commission does not speculate on carbon price developments or make projections on the price impacts of legislative proposals. The EU ETS remains a market-based system where prices are determined by supply and demand.
The proposed change does not have an immediate impact on the market balance. Under the proposal, allowances in the MSR would only be released into the market at times of market tightness or excessive price increases.
A comprehensive review of the EU ETS will follow in July 2026.

How will the proposal support Europe’s competitiveness while delivering on its climate targets?

Mainly thanks to the ETS, domestic emissions in the EU dropped by 39%, while the economy grew by 71% between 1990 and 2024. The proposal strengthens the EU ETS, so it continues to drive emissions reductions while providing the stability and predictability that industry needs to invest in the transition.
At the same time, strengthening the Market Stability Reserve improves the system’s ability to respond to market imbalances and reduces the risk of excessive price volatility. A more stable and predictable carbon market provides greater certainty for businesses planning long-term investments in clean technologies.
 
 
Compliments of the European Commission The post European Commission | Questions and Answers on the EU ETS Market Stability Reserve first appeared on European American Chamber of Commerce New York [EACCNY] | Your Partner for Transatlantic Business Resources.

EACC

OECD | Global Economic Outlook Remains Robust but has Weakened Amid Energy Shock and Geopolitical Risks

The resilience of the global economy is being tested by the evolving conflict in the Middle East, which has generated new inflationary pressures while creating significant uncertainty, according to the OECD’s latest Interim Economic Outlook.
Global growth was steady heading into 2026, supported by the strength of technology-related production, lower effective tariffs on US imports and the momentum carried over from 2025. The energy supply shock following the onset of the conflict in the Middle East is expected to significantly weigh on global growth while putting new upward pressure on inflation.
As a result of these developments, the Outlook projects global growth of 2.9% in 2026 and 3.0% in 2027. The evolution of the conflict in the Middle East is highly uncertain and poses considerable risks to these baseline projections. A more long-lasting disruption, with energy prices remaining elevated beyond mid-2026, would further reduce growth prospects.
GDP growth in the United States is projected at 2.0% in 2026, before moderating to 1.7% in 2027. In the euro area, growth is projected to be 0.8% in 2026 and 1.2% in 2027. China’s growth is projected to slow to 4.4% in 2026 and 4.3% in 2027.
Inflation pressures will persist for a longer period, with inflation now expected to be higher in 2026 than previously projected, reflecting the surge in global energy prices. Headline inflation in G20 countries is projected to be 4.0% in 2026, easing to 2.7% in 2027. Click here to see the projections

“The energy supply shock from the evolving conflict in the Middle East is testing the resilience of the global economy. We project global growth will remain robust, but it will be slower than the pre-conflict trajectory, with significantly higher inflation,” OECD Secretary-General Mathias Cormann said. “Any policy measures adopted to cushion the impact of the energy price shock should be targeted towards those most in need, temporary, and ensure incentives to save energy are preserved. Increasing renewable energy generation and energy efficiency can enhance economic security while boosting resilience to future price shocks.”
The Outlook highlights a range of risks. The expected decline in future energy prices is based on assumptions that current disruptions to supply will ease over time, and be limited in 2027. Longer-lasting closure of oil and gas production facilities in the region or persistent disruptions to exports through the Strait of Hormuz would likely have more significant adverse consequences on energy prices, inflation expectations and future growth.
The Outlook points out that higher energy and fertiliser prices could spur increases in food prices, particularly affecting vulnerable households. Higher energy prices could also increase the cost for European countries carrying out necessary annual replenishing of natural gas stocks. Financial markets may experience additional volatility while rising long-term sovereign yields increase fiscal risks.
Given these challenges, the Outlook highlights key priorities for policymakers. Central banks should remain vigilant and ensure expectations are well-anchored. Stronger efforts are needed to safeguard the sustainability of public finances. Any measures to cushion the economic impact of the energy shock will need to be targeted, temporary and take into account limited fiscal space facing most governments. Lowering trade barriers would boost output and reduce inflationary risks. Over the medium term, improving energy efficiency and reducing dependency on fossil fuel imports can lower exposure to future supply shocks.
For the full report and more information, consult the Interim Economic Outlook online. Media queries should be directed to the OECD Media Office (+33 1 45 24 97 00).
Watch the live webcast of the press conference

Working with over 100 countries, the OECD is a global policy forum that promotes policies to preserve individual liberty and improve the economic and social well-being of people around the world.


Compliments of the Organisation for Economic Co-operation and DevelopmentThe post OECD | Global Economic Outlook Remains Robust but has Weakened Amid Energy Shock and Geopolitical Risks first appeared on European American Chamber of Commerce New York [EACCNY] | Your Partner for Transatlantic Business Resources.

Read More
EACC

IMF | How the War in the Middle East is Affecting Energy, Trade, and Finance

Energy prices, supply chains, and financial markets are the main transmission channels, but the regional effects will vary significantly.
The world faces yet another shock. The war in the Middle East is upending lives and livelihoods in the region and beyond. It is also dimming the outlook for many economies that had only just shown signs of a sustained recovery from previous crises.
The shock is global, yet asymmetric. Energy importers are more exposed than exporters, poorer countries more than richer ones, and those with meager buffers more than those with ample reserves.
Beyond its painful human toll, the war has caused serious disruption to the economies of the most directly affected countries, including damage to their infrastructure and industries that could become long-lasting. Although these countries are resilient, their short-term growth prospects will be negatively affected.
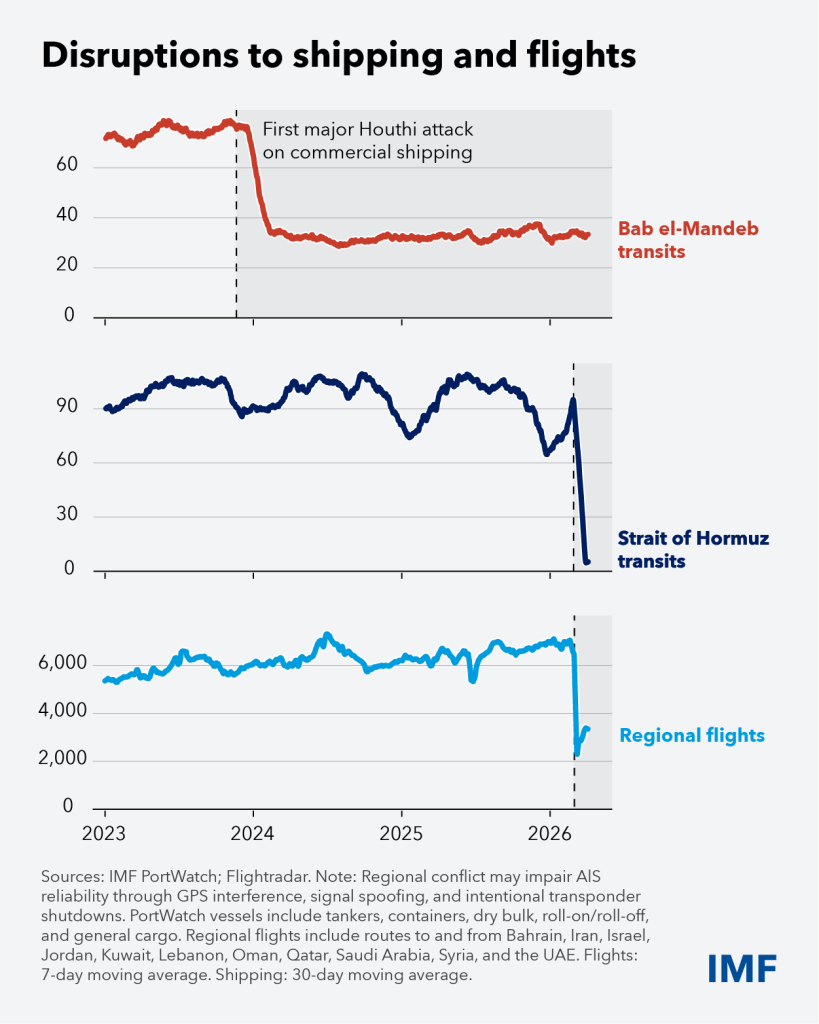
Meanwhile, large energy importers in Asia and Europe are bearing the brunt of higher fuel and input costs: about 25 to 30 percent of global oil and 20 percent of liquefied natural gas pass through the Strait of Hormuz, feeding demand not only in Asia but also in parts of Europe. Economies heavily dependent on oil imports in Africa and Asia are finding it increasingly hard to access the supplies they need, even at inflated prices.
Parts of the Middle East, Africa, Asia-Pacific, and Latin America face the added strain of higher food and fertilizer prices and tighter financial conditions. Low-income countries are especially at risk of food insecurity; some may need more external support—even as such assistance has been declining.

Although the war could shape the global economy in different ways, all roads lead to higher prices and slower growth. A short conflict might send oil and gas prices soaring before markets adjust, while a long one could keep energy expensive and strain countries that rely on imports. Or the world may settle somewhere in between—tensions linger, energy stays costly, and inflation proves hard to tame—with ongoing uncertainty and geopolitical risk. Much depends on how long the conflict lasts, how far it spreads, and how much damage it inflicts on infrastructure and supply chains.
We are closely monitoring these developments and will provide a fuller assessment in our World Economic Outlook and Global Financial Stability Report, to be published on April 14, followed by our Fiscal Monitor on April 15.
Energy prices
Energy is the main transmission channel. The de facto closure of the Strait of Hormuz and damage to regional infrastructure have produced the largest disruption to the global oil market in its history, according to the International Energy Agency. For fuel‑importing economies, the effect is that of a large, sudden tax on income.

The multi-regional impact is apparent. Energy‑importing economies in Africa, the Middle East and Latin America are feeling the strain from higher import bills on top of already limited fiscal space and external buffers.
In Asia’s large manufacturing economies, higher fuel and power bills are raising production costs and squeezing people’s purchasing power; in some, balance‑of‑payments pressures are already weighing on currencies. In Europe, the shock is reviving the specter of the 2021–22 gas crisis, with countries such as Italy and the United Kingdom especially exposed by their reliance on gas‑fired power, while France and Spain are relatively protected by their greater nuclear and renewables capacity.
By contrast, oil‑exporting countries in the Middle East, parts of Africa, and Latin America that can still get their barrels to market have a prospect of stronger fiscal and external positions from higher prices. Producers whose exports are constrained or curtailed—including several Gulf Cooperation Council members—can expect much less upside. Even after transit resumes, higher risk premia and uncertainty may curb investment and growth.
Supply chains
The war is also reshaping supply chains for non-energy and critical inputs. Rerouting tankers and container ships raises freight and insurance costs and lengthens delivery times. Air‑traffic disruptions around key Gulf hubs impact global tourism while adding another layer of complexity to trade.
In addition to higher commodity prices, countries, companies, and consumers already face the effects of these supply‑chain complications. With shipments of fertilizer—of which about one-third passes through the Strait of Hormuz—disrupted, concerns about food prices are mounting. The interruption of crop-nutrient supplies from the Gulf comes just as planting season begins in the Northern Hemisphere, threatening yields and harvests through the year and pushing food prices higher.
The most vulnerable will bear the heaviest burden. People in low‑income countries are most at risk when prices rise because food accounts for about 36 percent of consumption on average, compared with 20 percent in emerging market economies and 9 percent in advanced economies. That makes any spike in fertilizer and food prices not just an economic problem but a socio-political one, especially where fiscal resources to cushion the blow are limited.
There could also be shortages or price surges of other materials used in manufacturing. The Gulf supplies a large share of the world’s helium, used in a vast array of products from semiconductors to medical imaging devices. Indonesia, which provides roughly half of global nickel—a key component in electric‑vehicle batteries—could face a shortage of sulfur needed to process the metal. Eastern African economies that depend on trade links with and remittances from Gulf countries face weaker demand for their services exports, logistical bottlenecks and reduced remittances.
Inflation and inflation expectations
If elevated energy and food prices persist, they will fuel inflation worldwide. Historically, sustained oil‑price spikes have tended to push inflation higher and growth lower. Over time, higher transport and input costs work their way into the prices of manufactured goods and services. For many countries that had only just brought inflation closer to target, and even more so those with stickier inflation, this risks a renewed period of uncomfortable price pressures.
Here, too, the pattern is uneven. In much of Asia and parts of Latin America, where inflation had been relatively low, higher energy and food costs will test the resilience of expectations, particularly in economies with weaker currencies and large energy imports. In Europe, another energy‑driven spike in prices would come on top of existing cost‑of‑living strains, raising the risk of more persistent wage demands. In low‑income countries where people spend a large share of their income on food, especially in Africa and parts of the Middle East, and Central America higher food prices carry acute social and economic costs.
If people and businesses in any of these regions believe inflation will remain higher for longer, they may build this into wages and prices, making it harder to contain the shock without a sharper slowdown. The war thus raises not only current inflation but also a risk of expectations becoming less firmly anchored.
Financial conditions
Finally, the war has unsettled financial markets. Global stock prices have declined, bond yields have risen across major advanced economies and many emerging markets, and volatility has increased. The market sell-off has so far been contained compared with past global shocks. Nonetheless, these moves have tightened financial conditions worldwide.
Again, effects vary. In Europe and many emerging markets, higher yields and wider credit spreads raise debt‑service burdens and complicate refinancing for governments and firms alike. In sub‑Saharan Africa and some low‑income economies in the Middle East and South Asia, already meager reserves and limited market access make external shocks to financing conditions more dangerous—especially as higher import bills for fuel, fertilizer, and food widen trade deficits and put pressure on currencies. In the Middle East and elsewhere, high levels of debt and tighter financial conditions may further raise debt financing costs.
By contrast, advanced economies with deep domestic capital markets and some commodity exporters with ample buffers—such as Saudi Arabia and United Arab Emirates, or Latin American commodity producers like Brazil and Ecuador—can better absorb market stress, even if they are not immune to higher risk premia.
The IMF’s role
These channels show why the war’s economic impact is both global and highly uneven. They help explain why the same shock can look like a terms‑of‑trade windfall for some countries, a balance‑of‑payments strain for others, and a renewed cost‑of‑living squeeze across many economies.
Such complex spillovers confront us at a time when many economies have limited room to absorb shocks. Many countries were already facing record-high debt levels, raising concerns about fiscal sustainability.
To manage the shock and maintain resilience, it is therefore more important than ever that countries adopt appropriate policies. Measures need to be carefully calibrated to country-specific needs. Countries with limited reserves and little fiscal room to maneuver should be especially cautious.
At this pivotal moment, the IMF is stepping up as well. We are supporting our members—especially the most vulnerable—with policy advice, capacity development and, where needed and in coordination with the international community, financial assistance. As Managing Director Kristalina Georgieva has said: “In an uncertain world, more countries are needing more of our support. We are there for them.”
 
 
Compliments of the International Monetary FundThe post IMF | How the War in the Middle East is Affecting Energy, Trade, and Finance first appeared on European American Chamber of Commerce New York [EACCNY] | Your Partner for Transatlantic Business Resources.

EACC

ECB | Where do the Costs of Higher US Tariffs Fall?

Understanding the impact of tariffs on inflation is a complex task as it involves analysing responses along the pricing chain, including those by foreign exporters, distributors, producers and retailers. At different stages of this pricing chain, domestic firms could respond to tariff announcements by building up inventories before tariffs are implemented, shifting the sourcing of their imports from countries facing higher tariffs to countries facing lower tariffs (trade diversion) and adjusting the pricing of their products to accommodate the impact of tariffs. This analysis is made all the more intricate by exchange rate developments and exemptions for goods in transit at the time of tariff implementation. In this box, we estimate the impact of recently imposed US tariffs on the prices exporters are charging for products delivered to the United States and explore differences in the pricing behaviour of exporters across countries and sectors observed to date. We show that the costs of tariffs are falling mostly on US firms and consumers and only 5% of costs are borne by foreign firms.
Following a series of tariff increases imposed by the United States, both the prices (net of tariffs) and the volumes of goods it imports have been declining. From January to November 2025, the announced statutory effective tariff rate increased significantly from 3% to over 18%.[1] The annual change in the prices of goods imported into the United States, measured as unit values and reported net of tariffs, has been slightly negative since April. Volumes of imported goods have declined sharply. However, the magnitude of the adjustments in prices and quantities varies across major trading partners, such as China, Canada, Mexico and the EU, which were targeted by higher tariffs. These differences could reflect variations in tariff rates and scope, shifts in the composition of imports and country-specific dynamics.
Exporters to the United States are absorbing only a small fraction of higher tariff-related costs. In aggregate, unit values of imported goods reported net of tariffs show an average pass-through coefficient of 0.95 (Chart A, panel a).[2] This means that a 10% increase in tariffs implies only a 9.5% increase in prices. Therefore, only a small fraction of the increased tariffs is being absorbed by exporters.[3] The pass-through coefficient is significantly lower when looking at specific sectors.[4] However, no significant differences are evident in the estimated tariff pass-through by major trading partners.

Chart A
Impact of tariffs on unit values and volumes of imported goods

a) Unit values of imported goods
(elasticity; complete pass-through = 1)

b) Volumes of imported goods
(elasticity)

Source: ECB staff calculations.
Notes: The reported estimates are based on a panel regression analysis of six-digit product categories of the harmonised system (HS6) import unit values, following the methodology of Amiti et al. (2019). Estimated on a sample from January 2024 to October 2025. The upper part of panel b) reports estimates of the aggregate elasticity (extensive and intensive margin) obtained from a regression where product categories, including those subject to higher tariffs, are no longer imported into the United States. The lower part of panel b) reports estimates obtained from a regression on those product categories which are still traded under tariffs.

The estimated impact of tariffs on import volumes is large. The estimated aggregate elasticity of imports for all product categories stands at -3.7. This means that a 10% increase in tariffs would result in a 37% decline in import volumes. If, by contrast, we focus on only those product categories which are still traded under tariffs, the estimated coefficient declines markedly, albeit remaining economically relevant at ‑0.43. This means that a 10% increase in tariffs would result in a 4.3% decline in import volumes. This difference in estimated elasticity for import volumes suggests that the observed decline is largely associated with products which, in response to tariffs, are no longer traded – meaning they undergo an adjustment through the extensive margin (Chart A, panel b, upper graph). However, volumes also decline markedly for products which are still being traded under tariffs (trade adjustment through the intensive margin; Chart A, panel b, lower graph).
Zooming in on the automotive sector highlights how tariffs triggered significant changes in trade structures, particularly within regional supply chains. In the automotive sector, the results point to a clear decoupling of the United States from China and the EU in favour of Canada and Mexico (Chart B). The surge in car imports from Canada and Mexico reflects a strengthening of existing trade relationships.[5] This stands in sharp contrast to the results reported for the EU and Japan, which saw both a contraction in the unit value of exported cars and a strong decline in the volume of products subject to tariffs and still exported to the United States.[6]

Chart B
Impact of tariffs on unit values and volumes of cars imported to the United States

a) Unit values of imported cars

b) Volumes of imported cars

(elasticity; complete pass-through = 1)

(aggregate elasticity)

Source: ECB staff calculations.
Notes: The reported estimates are based on a panel regression analysis of six-digit product categories of the harmonised system (HS6) import unit values, following the methodology of Amiti et al. (2019). Estimated on a sample from January 2024 to October 2025.

While tariffs are reshaping the geography of trade relations with the United States, their costs are falling mostly on domestic importers and consumers. We find that costs associated with higher tariffs are passed down the pricing chain, with consumers currently bearing around a third of the tariff burden (Chart C). And if the higher tariffs are expected to stay in place for a longer period, the available survey evidence from US firms suggests that they will pass a larger share of tariff-related costs on to consumers. Over the longer term, this share could rise to over half as US firms exhaust their ability to absorb costs. Additionally, if the extent to which exporters absorb tariffs remains limited in scope, as reported above, this implies that US firms would absorb around 40% of higher tariff costs in the longer term.

Chart C
Distribution of tariff-implied costs along the pricing chain

(coefficient estimates)

Source: ECB staff calculations.
Notes: The chart shows how tariff costs are distributed across the pricing chain, based on empirical analyses using data available up to August 2025 (dark blue). The grey bars represent residual attributions, with hashed sections indicating survey results from Andrade et al. (2025), which suggest that the tariff pass-through to consumers increases to 0.55 when in place over longer time horizons. The figure for consumers is derived from a panel regression of tariffs on personal consumption expenditures PCE components, while the figure for exporters is based on a panel regression analysis of six-digit product categories of the harmonised system (HS6) import unit values, following the methodology of Amiti et al. (2019). “Firms” refers to distributors, producers and retailers.

References
Amiti, M., Redding, S.J. and Weinstein, D.E. (2019), “The Impact of the 2018 Tariffs on Prices and Welfare”, Journal of Economic Perspectives, Vol. 33, No 4, pp. 187-210.
Amiti, M., Flanagan, C., Heise, S. and Weinstein, D.E. (2026), “Who Is Paying for the 2025 U.S. Tariffs?”, Liberty Street Economics, Federal Reserve Bank of New York, 12 February.
Andrade, P., Dietrich, A.M., Leer, J., Lin, X., Schoenle, R.S., Tang, J. and Zakrajšek, E. (2025), “Who Will Pay for Tariffs? Businesses’ Expectations about Costs and Prices”, Current Policy Perspectives, No 25-13, Federal Reserve Bank of Boston, 29 September.
Hinz, J., Lohmann, A., Mahlkow, H. and Vorwig, A. (2026), “America’s Own Goal: Who Pays the Tariffs?”, Kiel Policy Brief, No 201, Kiel Institute for the World Economy.
Le Roux, J. and Spital, T. (2026), “Global trade redirection: tracking the role of trade diversion from US tariffs in Chinese export developments”, Economic Bulletin, Issue 1, ECB.

There is a difference between statutory and actual effective tariff rates. The statutory effective tariff rate is calculated based on tariff announcements and a usually fixed trade structure, whereas the actual tariff rate is derived from customs data and is typically lower. The World Trade Organization reports in its tariff tracker that the statutory effective tariff rate on goods for the United States was 18.2% in November 2025, whereas the actual effective tariff rate on goods for the same month was 9.8%. For economic analysis, the statutory effective tariff rate is typically used as the explanatory variable as the implementation date is judged to be more relevant compared with customs reports data, which often suffer from reporting lags and endogeneity bias caused by changing trade volumes triggered by tariffs.

Aggregate effects are captured through time fixed effects, while product-level characteristics are controlled for by including item fixed effects following Amiti et al. (2019). The tariff effect is identified by the common movement of the dependent price variable in response to tariff changes within all items across time.

This finding is broadly consistent with the evidence from the 2018-19 period as documented in Amiti et al. (2019). It is also in line with the available estimates for the current tariffs (Hinz et al., 2026), suggesting that the United States possesses limited terms-of-trade leverage over its global suppliers in the short term. While Amiti et al. (2026) report a similar tariff pass-through (elasticity) of 0.94 for the period from January to August 2025, they find it declined to 0.86 in November.

Steel and aluminium, cars and car parts were targeted early on by the US Administration and faced significant tariffs ranging from 25% to 50%, with few exemptions.

Rerouting of Chinese car exports via these countries may have contributed to these developments, although recent analyses suggest that Chinese exports may have been rerouted through countries in the Association of Southeast Asian Nations. For further details, see Le Roux and Spital (2026).

The estimated elasticity on the trade volume at the intensive margin is 0.84 for Canada and Mexico and ‑1.26 for the EU.


Compliments of the European Central BankThe post ECB | Where do the Costs of Higher US Tariffs Fall? first appeared on European American Chamber of Commerce New York [EACCNY] | Your Partner for Transatlantic Business Resources.

EACC

European Council | EU customs: Council and Parliament Agree on Landmark Reform

The Council and the Parliament today agreed to overhaul the EU customs framework, giving the Union a more modern toolbox to deal with trends such as huge increases in trade volumes, especially in e-commerce, a fast-growing number of EU standards that must be checked at the border and challenging geopolitical realities.
The reform establishes innovative new instruments to facilitate global trade, collect customs duties more efficiently and to tighten controls on non-compliant, dangerous or unsafe goods. Overall, the new system will allow for more robust controls without excessive burden for authorities and traders.

“Today’s agreement marks the greatest reform since the creation of the Customs Union in 1968. The new Union customs code will allow us to deal with the multiple challenges prompted by the new geopolitical realities, while ensuring economic security. Once adopted, this modern toolbox will facilitate trade and ensure the proper collection of duties, in a simplified manner, and with the required legal certainty.” – Makis Keravnos, Minister of Finance of the Republic of Cyprus

The co-legislators have agreed on legislation to:

create a single, state-of-the-art EU customs data hub: one central platform for importers and exporters to interact with customs in the EU, strengthening data integrity, traceability and customs controls
introduce enhanced customs simplifications for the most trusted traders, saving them time and money
implement a new EU-wide handling fee for items contained in small parcels entering the EU
establish a new decentralised agency for customs – the EU customs authority – which will oversee the EU customs data hub while supporting the risk management work of national customs authorities.

The EU customs authority
The new decentralised EU agency for customs will coordinate governance of the EU customs union in certain areas.
To support the work of national offices, the EU customs authority will analyse the constantly updated import and export data contained in the new EU customs data hub, helping to identify the riskiest cargo entering the EU which should be prioritised for inspection.
The authority will also help establish priority control areas and risk criteria. Finally, it will coordinate EU-level crisis management in the area of customs.
The customs authority will be located in Lille, France. It will be established on the day that the overarching regulation enters into force.
The EU customs data hub
The EU customs data hub will be the single online environment designed to collect and analyse customs data to ensure the smooth flow of goods in and out of the EU. It will also support the EU-wide risk management carried out by the EU customs authority.
To fulfil their customs obligations, businesses importing to and exporting from the EU will only need to submit customs information once to this single portal, rather than to up to 27 individual customs authorities. They can enter the same information to cover multiple consignments, saving time and money.
National customs authorities will gain a full overview of trade flows and supply chains. With the support of the EU customs authority, member states will have access to the same real-time data and will be able to pool information to respond to risks more quickly, consistently and effectively.
Under the terms of the agreement, the data hub will become operational for e-commerce goods on 1 July 2028. A phased rollout will bring all movements of goods into its scope by 1 March 2034.
Trust and check traders
The updated legislation creates a new category of the most transparent businesses – trust and check traders.
Under this scheme, companies providing comprehensive information on the movement and compliance of goods, along with other stringent criteria, will enjoy more streamlined customs obligations, such as simplified procedures for temporary storage and transit.
The most reliable companies will be able to release their goods into circulation in the EU without any active customs intervention at all.
Other companies will still be able to enjoy the already existing simplifications available to trusted traders under the current authorised economic operator scheme.
Managing the influx of small parcels
To help cover rising costs from monitoring the growing number of small parcels entering the EU via e-commerce, the agreed text introduces a new handling fee to be collected by customs authorities on small consignments sold through distance selling.
The level of the fee will be decided by Commission delegated act before it starts being applied by EU member states no later than 1 November 2026.
The new rules also clarify that platforms and those selling into the EU by distance sale, e.g. via e-commerce, are considered the goods’ importer and responsible for ensuring that all customs formalities and payments are taken care of, rather than the final EU consumer.
Finally, the legislation will include a new system of financial penalties for e-commerce operators that systematically fail to comply with their customs obligations.
Next steps
The Council and the European Parliament will continue work to finalise the technical elements of the package before final adoption by the co-legislators. The new customs legislation will come into full application 12 months following publication in the EU’s official journal.
Background
For over 50 years, the EU customs union has been operating efficiently across national borders, managed by national customs offices working together. As one of the world’s largest trading blocs, the EU customs union manages trade worth over €4.3 trillion, accounting for around 14% of global trade.
In 2024, 2,140 customs offices, working 24 hours a day and 365 days a year, collected almost €27 billion as customs duties and handled the import, export and transit of more than 1,370 million items. In the same year, EU customs authorities detected 64,000 cases of goods presenting a risk for consumers in terms of health and detained 112 million counterfeit items.
 
 
Compliments of the European Council The post European Council | EU customs: Council and Parliament Agree on Landmark Reform first appeared on European American Chamber of Commerce New York [EACCNY] | Your Partner for Transatlantic Business Resources.

EACC

European Parliament | EU US Trade Deal: MEPs Set Conditions for Lowering Tariffs on US Products

Suspension clause in case the US introduces new tariffs
Sunrise clause: tariff preferences only effective if the US respects its commitments
Sunset clause: tariff preferences set to expire by 31 March 2028, unless renewed

On Thursday, MEPs adopted their position on two proposals implementing the tariff aspects of the EU-US Turnberry trade deal.

The texts, if agreed with EU member states, will eliminate most tariffs on US industrial goods and provide preferential market access for a wide range of US seafood and agricultural goods, in line with the commitments made in summer 2025 between the EU and the US.
Suspension clause
MEPs strengthened the proposed suspension clause, which would allow the tariff preferences with the US to be suspended under a number of conditions. For instance, the Commission would be able to propose suspending all or some trade preferences if the US were to impose additional tariffs exceeding the agreed 15% ceiling, or any new duties on EU goods. The suspension clause could also be activated if the US, for example, undermined the objectives of the deal, discriminated against EU economic operators, threatened member states’ territorial integrity, foreign and defence policies, or engaged in economic coercion.
Sunrise clause
MEPs have introduced a “sunrise clause” that would mean that the new tariffs would only become effective if the US respects its commitments. These conditions include the US lowering its tariffs on EU products with a steel and aluminium content below 50%, to a tariff of maximum 15%.
Furthermore, for EU products with a steel and aluminium content of above 50%, unless the US reduces its tariffs to a maximum of 15%, EU tariff preferences for US exports of steel, aluminium and their derivative products would cease to apply six months after the entry into application of the regulation.
Sunset clause
Members also agreed on an expiry date for the main regulation on 31 March 2028. This could only be extended via a new legislative proposal, to be submitted following a thorough impact assessment of the effects of the regulation.
Safeguard mechanism
The Commission would be tasked with monitoring the impact of the new rules and would be able to suspend the new tariffs temporarily, should US imports reach a level that could cause serious harm to EU industry, for instance in the event of a 10% increase in imports of a particular group of products.
Quote
Rapporteur Bernd Lange (S&D, DE) said: “With today’s vote, we have a strong mandate for negotiations with the Council and we intend to make the most of it. MEPs will only be able to sign up to the trade terms of the deal if the regulation contains very strong and clear safeguards, and only after the US has fully respected the terms of the deal. I intend to defend this mandate firmly in the negotiations.
The conditions are clearly defined in Parliament’s position. They include a sunrise clause requiring full US compliance before the regulation can take effect, and a sunset clause ensuring full parliamentary oversight of any extension of the concessions, all the while remaining WTO-compliant. Any further tariff threat, or the failure of the deal to deliver for EU producers and consumers, will lead to the expiry of the legislation.”
Next steps
The two legislative acts were adopted by 417 votes in favour and 154 against, with 71 abstentions (adjustment of customs duties and opening of tariff quotas for the import of certain goods originating in the US); and 437 votes in favour and 144 against, with 60 abstentions (non-application of customs duties on imports of certain goods). MEPs are now ready to start negotiations with EU governments on the final shape of the legislation.
Background
On 27 July 2025, in Turnberry, Scotland, US President Donald Trump and European Commission President Ursula von der Leyen reached a deal on tariff and trade issues, outlined in a joint statement published on 25 August. On 28 August, the Commission published two legislative proposals aimed at implementing the tariff aspects of the statement. The first provides preferential access for US goods to the EU; the second extends the existing zero-tariff regime on imports of certain types of lobster.


Compliments of the European ParliamentThe post European Parliament | EU US Trade Deal: MEPs Set Conditions for Lowering Tariffs on US Products first appeared on European American Chamber of Commerce New York [EACCNY] | Your Partner for Transatlantic Business Resources.